Monitor History
Monitor History is MaxAEO’s run log: every monitoring run — when it ran, how long it took, how many prompts and platforms it covered, and whether it succeeded — is recorded here. Find it in the sidebar under Monitor → Monitor History.
Why you need it
Section titled “Why you need it”The Dashboard, Mentions, and other analytics pages show the results your monitoring produces. Monitor History answers questions about the process: When was the data last updated? Did the latest run finish? Why haven’t today’s numbers changed? Whenever a dashboard number looks off, your first stop is here — confirm the corresponding run actually completed.
The run log table
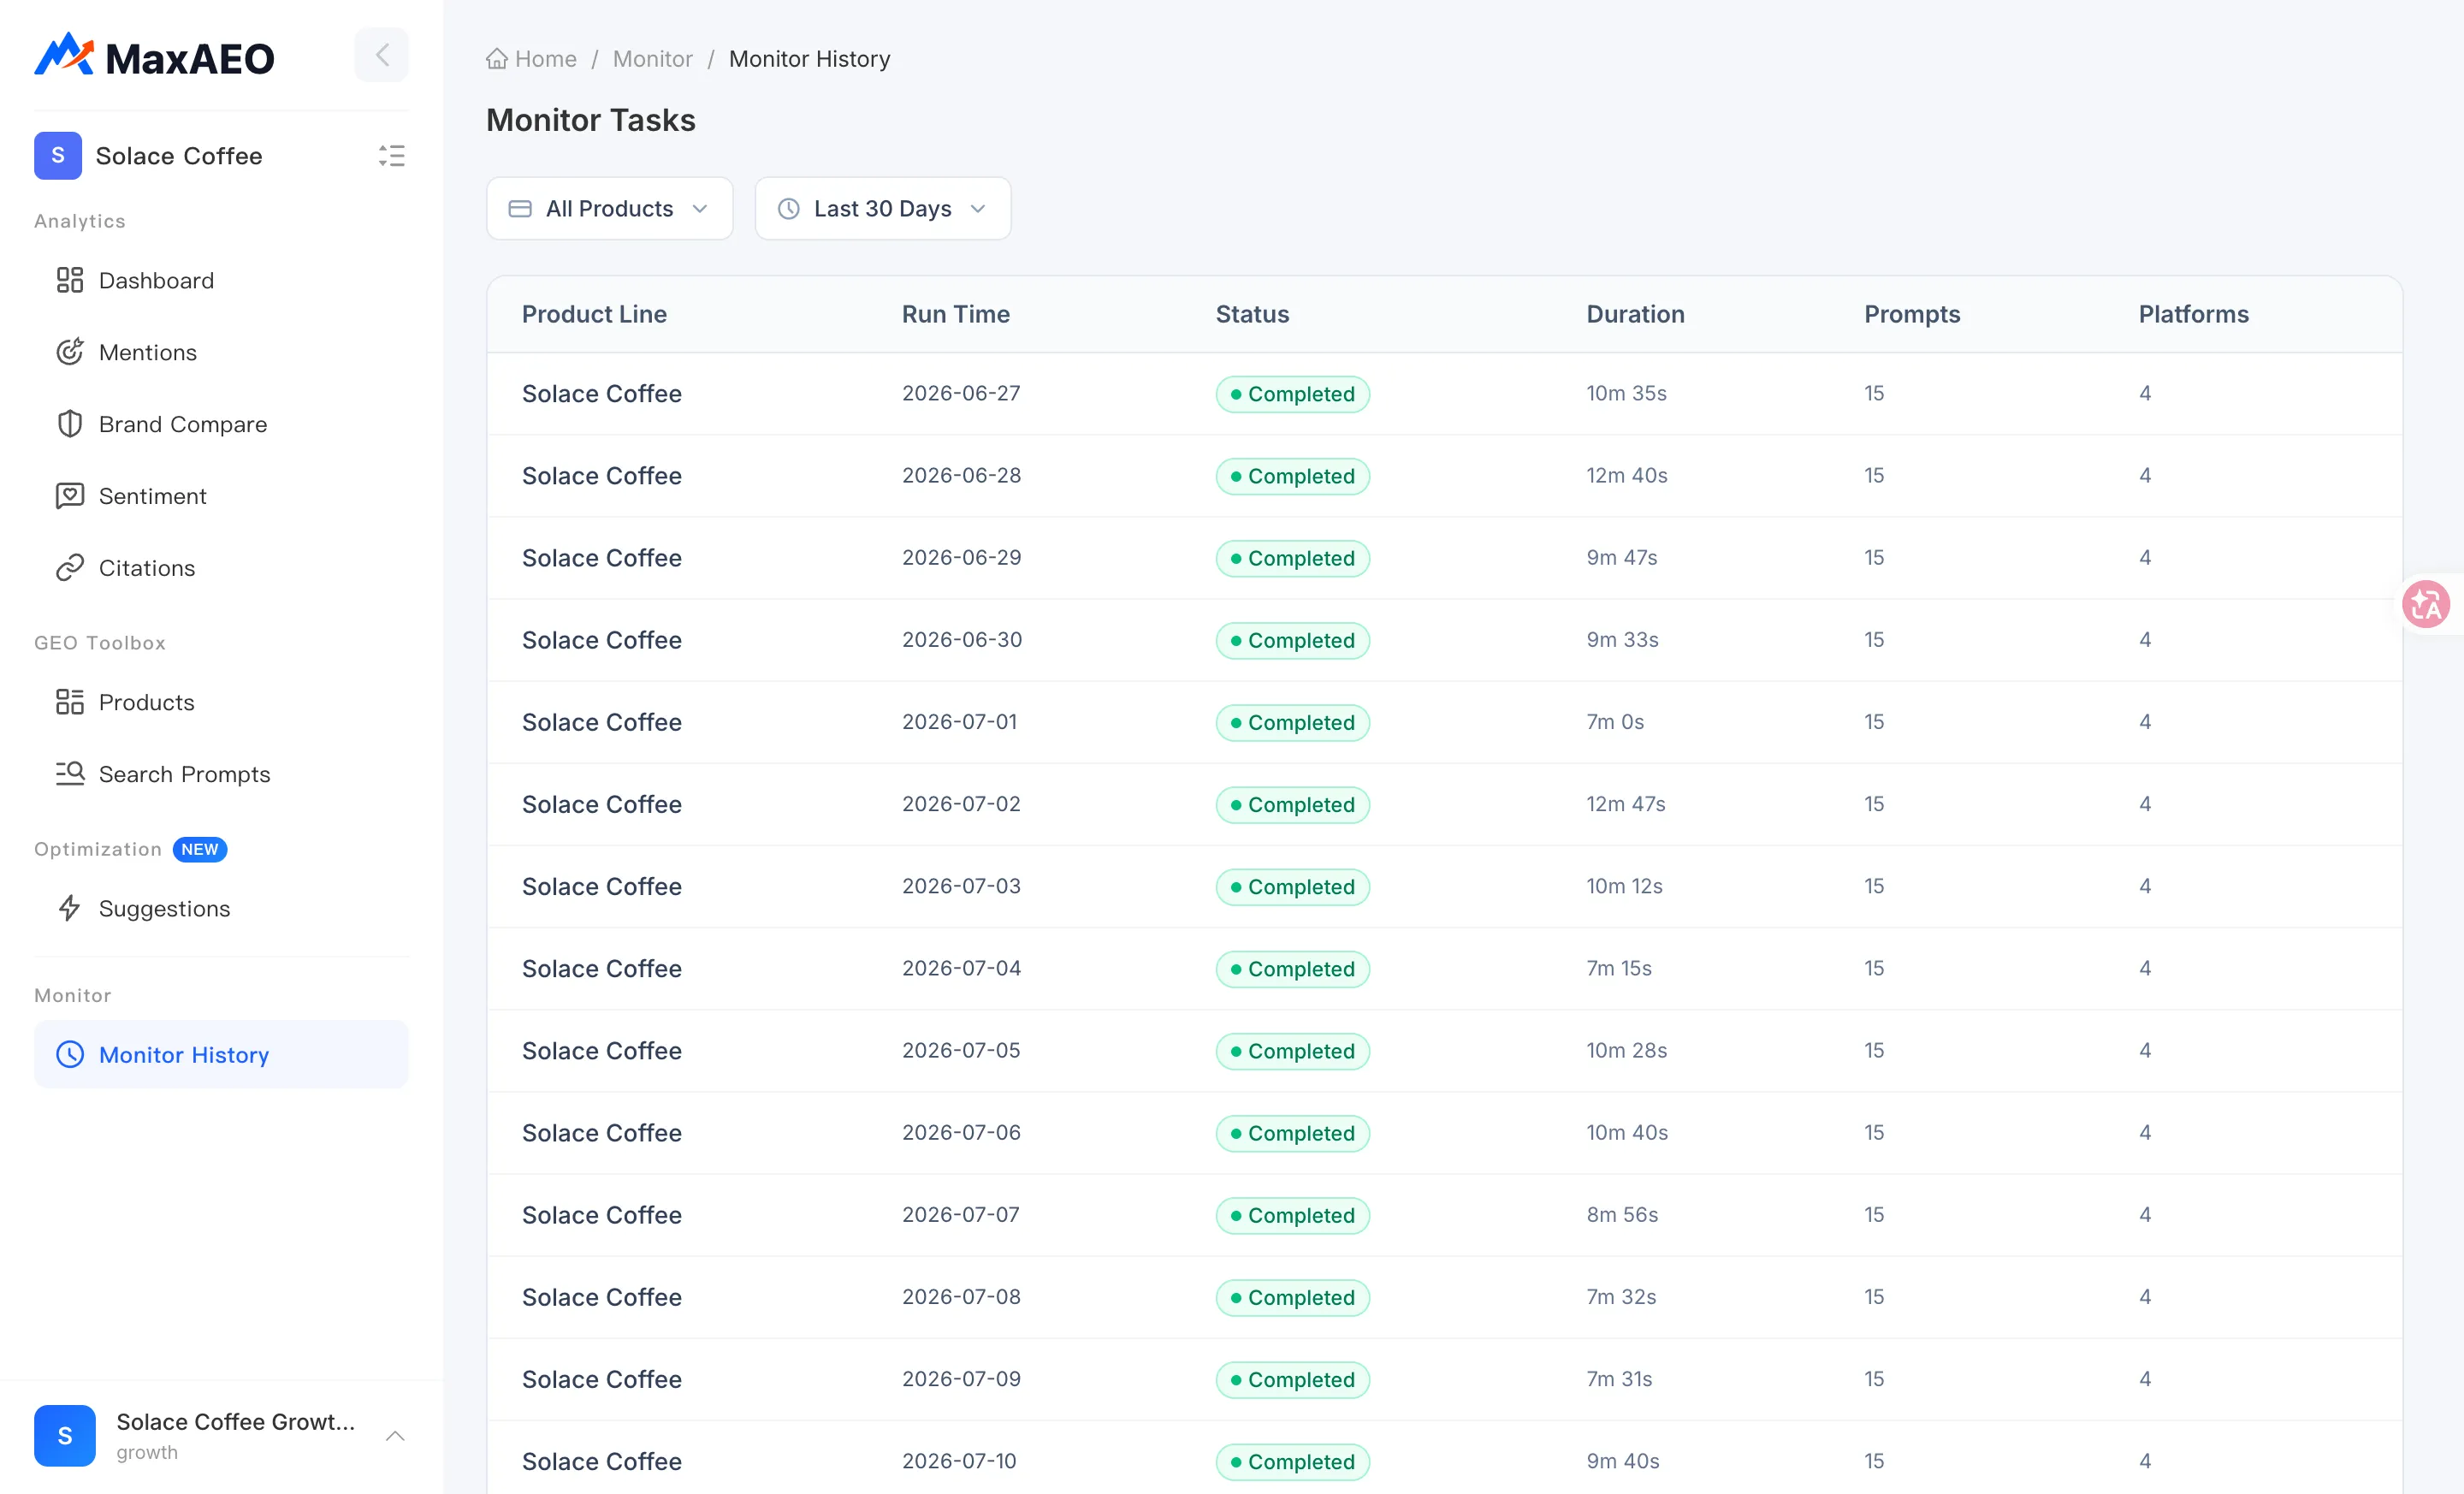
Section titled “The run log table”The page is built around a table where each row is one monitoring run, with the following columns:
- Product Line: which project the run belongs to. On multi-project accounts (Pro and above), runs from all projects appear together — use the filter to separate them.
- Run Time: when the run executed.
- Status: one of three values —
- Completed: the run finished normally and its data is available.
- Failed: the run didn’t complete; no new data was produced for this round.
- In Progress: the run is still executing — check back later.
- Duration: how long the run took from start to finish (formatted as “Xm Ys”).
- Prompts: how many monitored prompts this run actually executed.
- Platforms: how many AI platforms this run covered.
Prompts × Platforms gives you the total number of responses the run collected. For example, a row showing 10 prompts and 4 platforms means the run sent 10 prompts to each of 4 AI platforms — 40 responses in total. That’s the “total responses” figure behind your Mention Rate.
If you’ve just added or removed prompts or changed platforms in Products, the new configuration takes effect on the next run — compare the Prompts and Platforms columns across consecutive rows to confirm your changes went live.
Filters
Section titled “Filters”Two filters sit above the table:
- Product Line: defaults to “All Products”; switch to a single project to see only its runs.
- Time range: Last 7 Days, Last 14 Days, Last 30 Days, or a custom date range.
Track your first run here
Section titled “Track your first run here”After you create a project and click Start Monitor, the first full monitoring run kicks off automatically. While it’s running, the Dashboard and other data pages show a radar-scan empty state — to see exactly where things stand, open Monitor History and watch the run’s status:
- Status In Progress: the run is scanning the AI platforms. How long it takes depends on your prompt and platform counts — feel free to check back later.
- Status Completed: the data has been pushed to every analytics page automatically. Head back to the Dashboard to see your full KPIs, trends, and rankings.
Daily automatic runs work the same way: each time a run completes, the dashboards refresh on their own — no manual action needed.
What to do about a failed run
Section titled “What to do about a failed run”A Failed row is no cause for alarm: a single failed run doesn’t affect your historical data or stop future runs — the next scheduled run proceeds as usual. If failures keep recurring, or you need that round’s data urgently, see the troubleshooting guidance in the FAQ or contact us via Feedback in the user menu.