
Mentions
The Mentions page answers a question one level deeper than “what’s my Mention Rate”: for each monitored prompt, on each AI platform, did the answer actually mention your brand?
Why you need it
Section titled “Why you need it”The Dashboard tells you whether your Mention Rate is 40% or 35%, but not where that number comes from. Say you monitor 5 prompts across 4 platforms — 20 responses, 8 mentions. Which prompts account for those 8 mentions? Which platform never names you? Which prompt gets zero mentions everywhere?
Those answers decide what you optimize next. The Mentions page lays out every monitoring run prompt by prompt, taking you from “reading a metric” to “inspecting the evidence” — and ultimately to actionable optimization leads.
The four KPIs at the top
Section titled “The four KPIs at the top”The top row shows four KPI cards for the current project:
- Mention Rate: the percentage of monitored AI responses that mention your brand. This is the core metric across MaxAEO — see the Mention Rate page for the full definition.
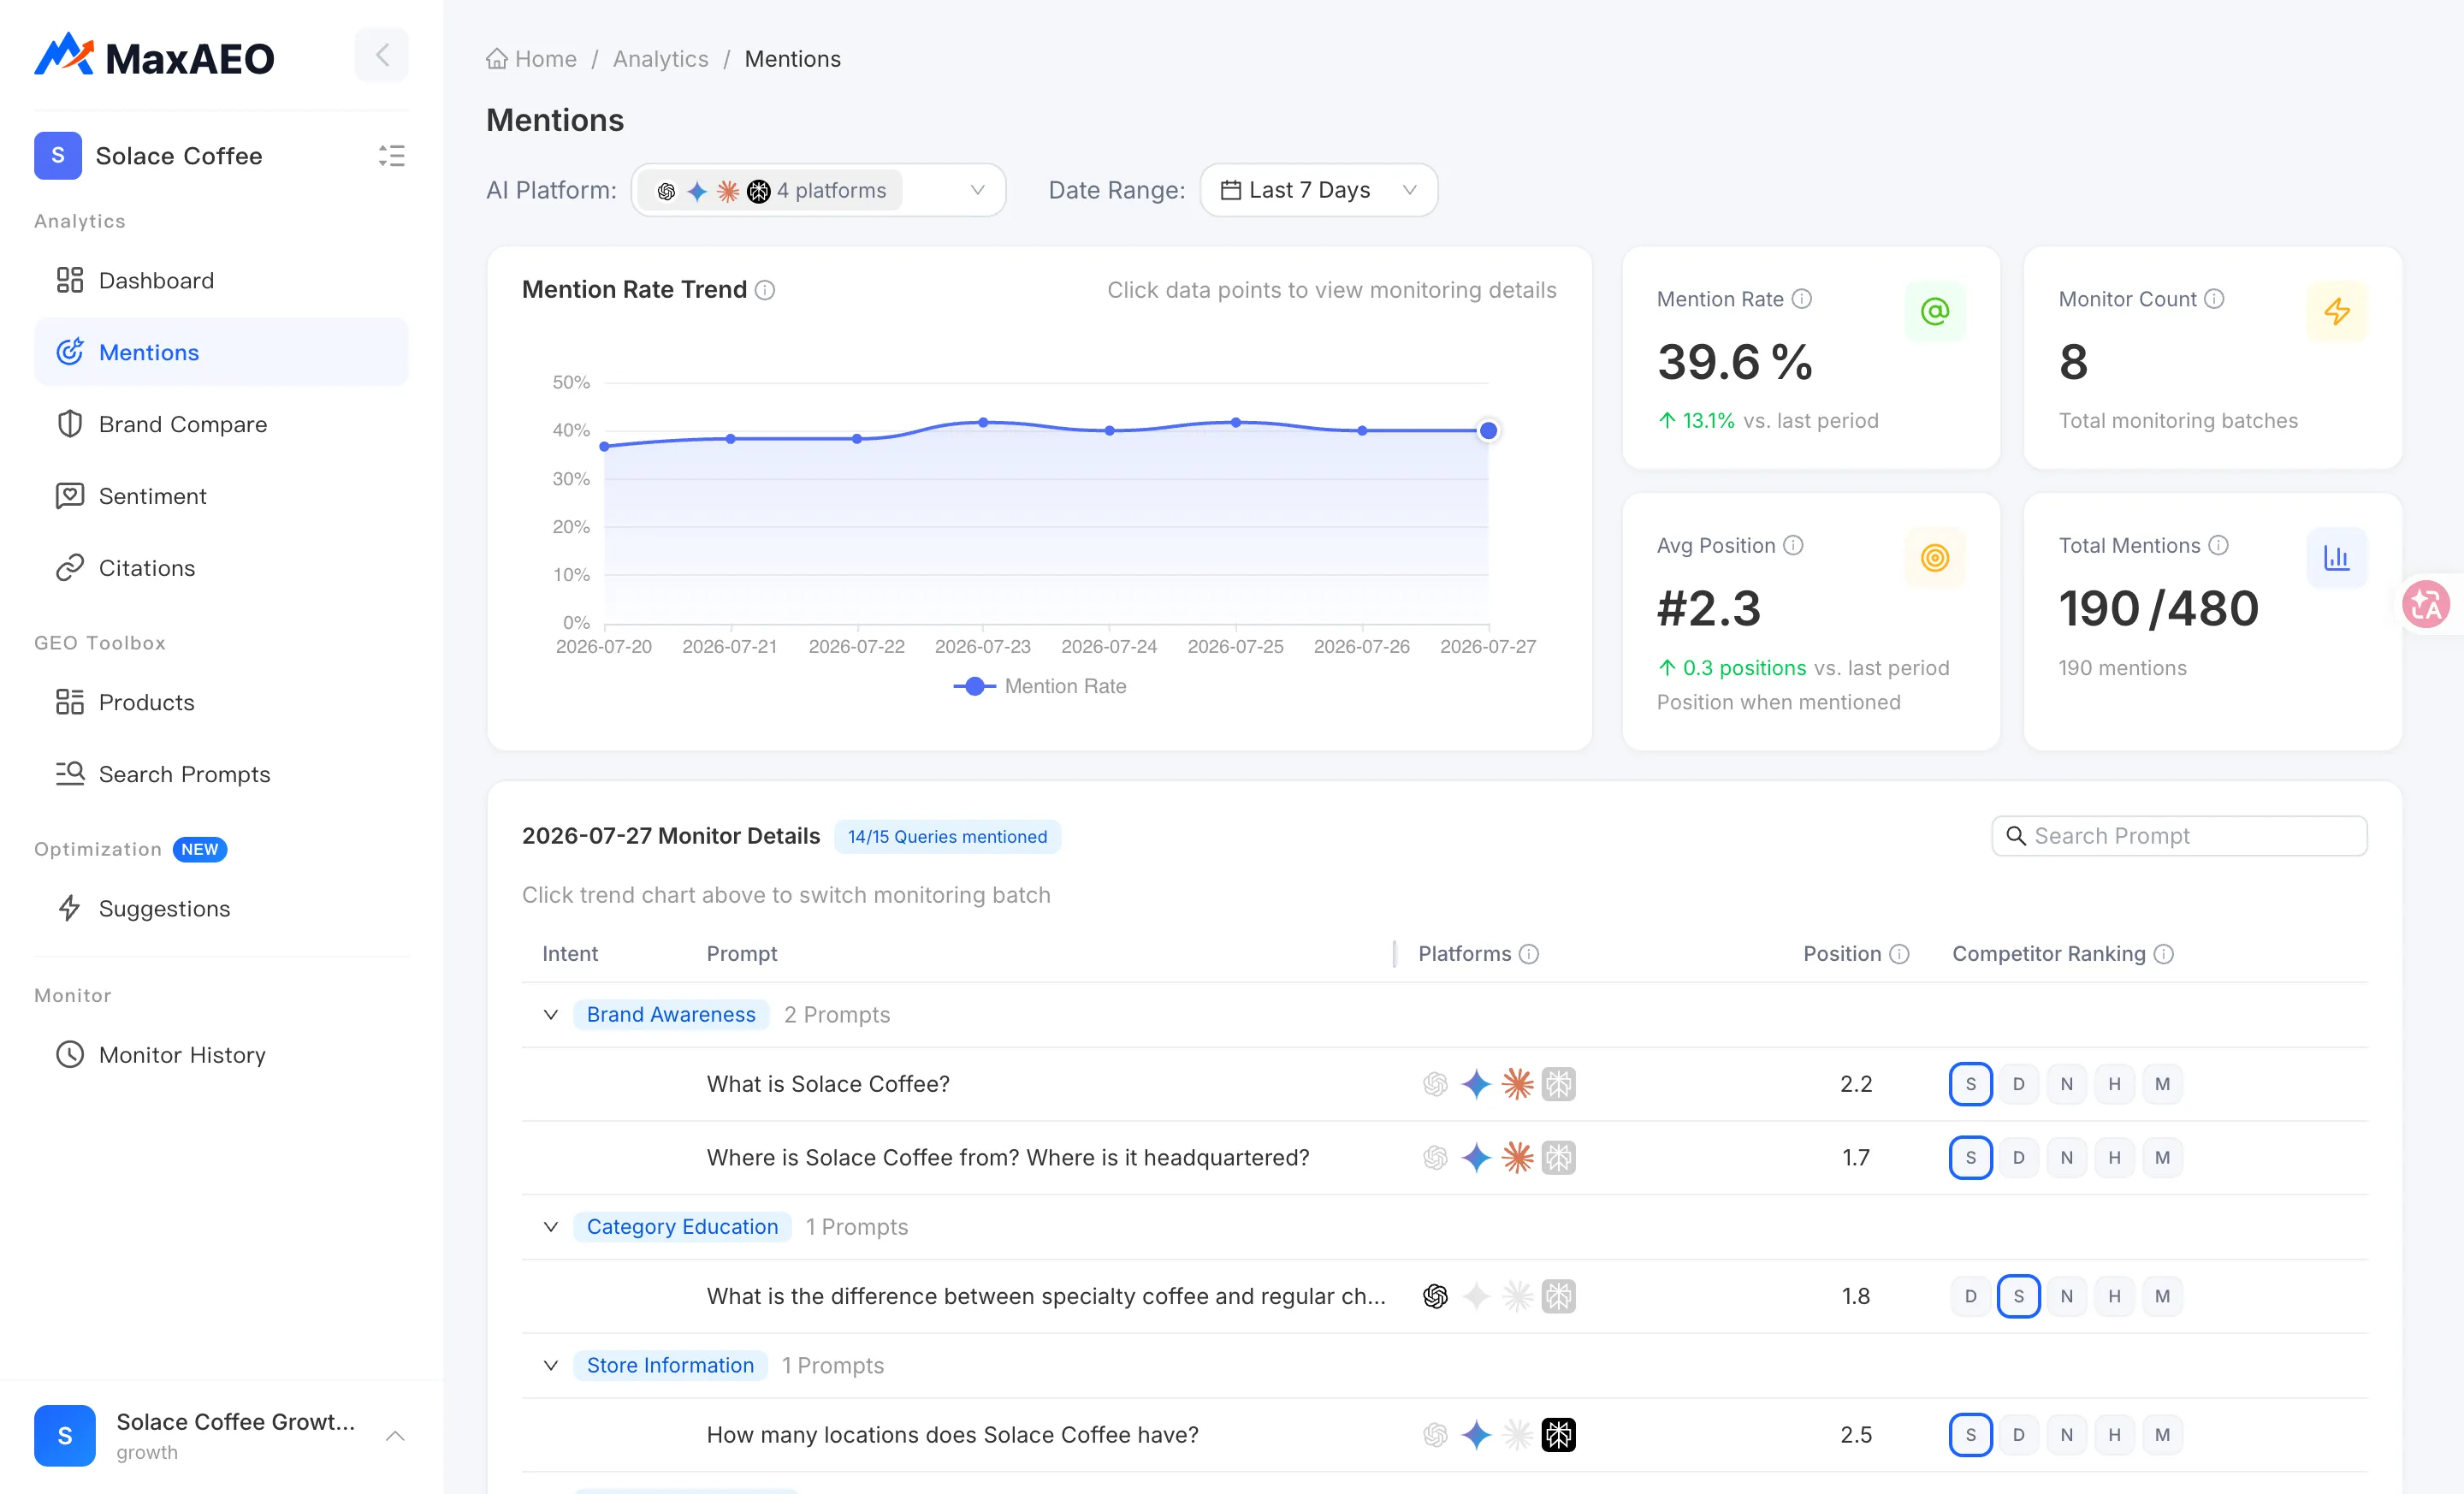
- Monitor Count: the total number of monitoring batches executed. More batches means a more trustworthy trend.
- Avg Position: when your brand is mentioned, the average position it holds in the recommendation list — lower is better. Note it only counts responses that mention you; see Avg Position.
- Total Mentions: total mentions vs total AI responses monitored. For example, “8 mentions” against 20 responses is exactly the 8/20 behind a 40% Mention Rate.
Mention Rate Trend, one point per batch
Section titled “Mention Rate Trend, one point per batch”Unlike the Dashboard’s day-by-day chart, the Mention Rate Trend chart here plots one data point per monitoring batch, with that batch’s Mention Rate on the y-axis.
The chart doubles as the switcher for the details table below:
-
Find the batch you want to inspect on the trend line — say, a point where the rate suddenly dropped.
-
Click the data point. The details table below switches to that batch’s results, with the monitor date shown in the table header.
-
Compare that batch against its neighbors row by row to pinpoint which prompts and platforms caused the drop.
The details table: every prompt, row by row
Section titled “The details table: every prompt, row by row”The details table is the heart of the page. Its header reads “{date} Monitor Details” and shows “x/y Queries mentioned” for the batch. Each row is one monitored prompt, with these columns:
- Intent: the prompt’s intent category (such as product recommendation, product comparison, or brand review), as set in Prompt management under Products.
- Prompt: the full question sent to the AI platforms.
- Platforms: a row of platform icons — a colored icon means that platform’s answer mentioned your brand; gray means it didn’t. Hover an icon to see “{platform} mentioned / not mentioned”. Scanning down this column instantly shows which platforms are blind to you.
- Position: where your brand appears in the AI’s recommendation list when mentioned — lower is better.
- Competitor Ranking: how competitors rank in the AI responses for this prompt. Hover to see each brand’s rank and mention count; your own brand carries a “You” tag.
When you monitor many prompts, use the Search Prompt box above the table to filter by keyword.
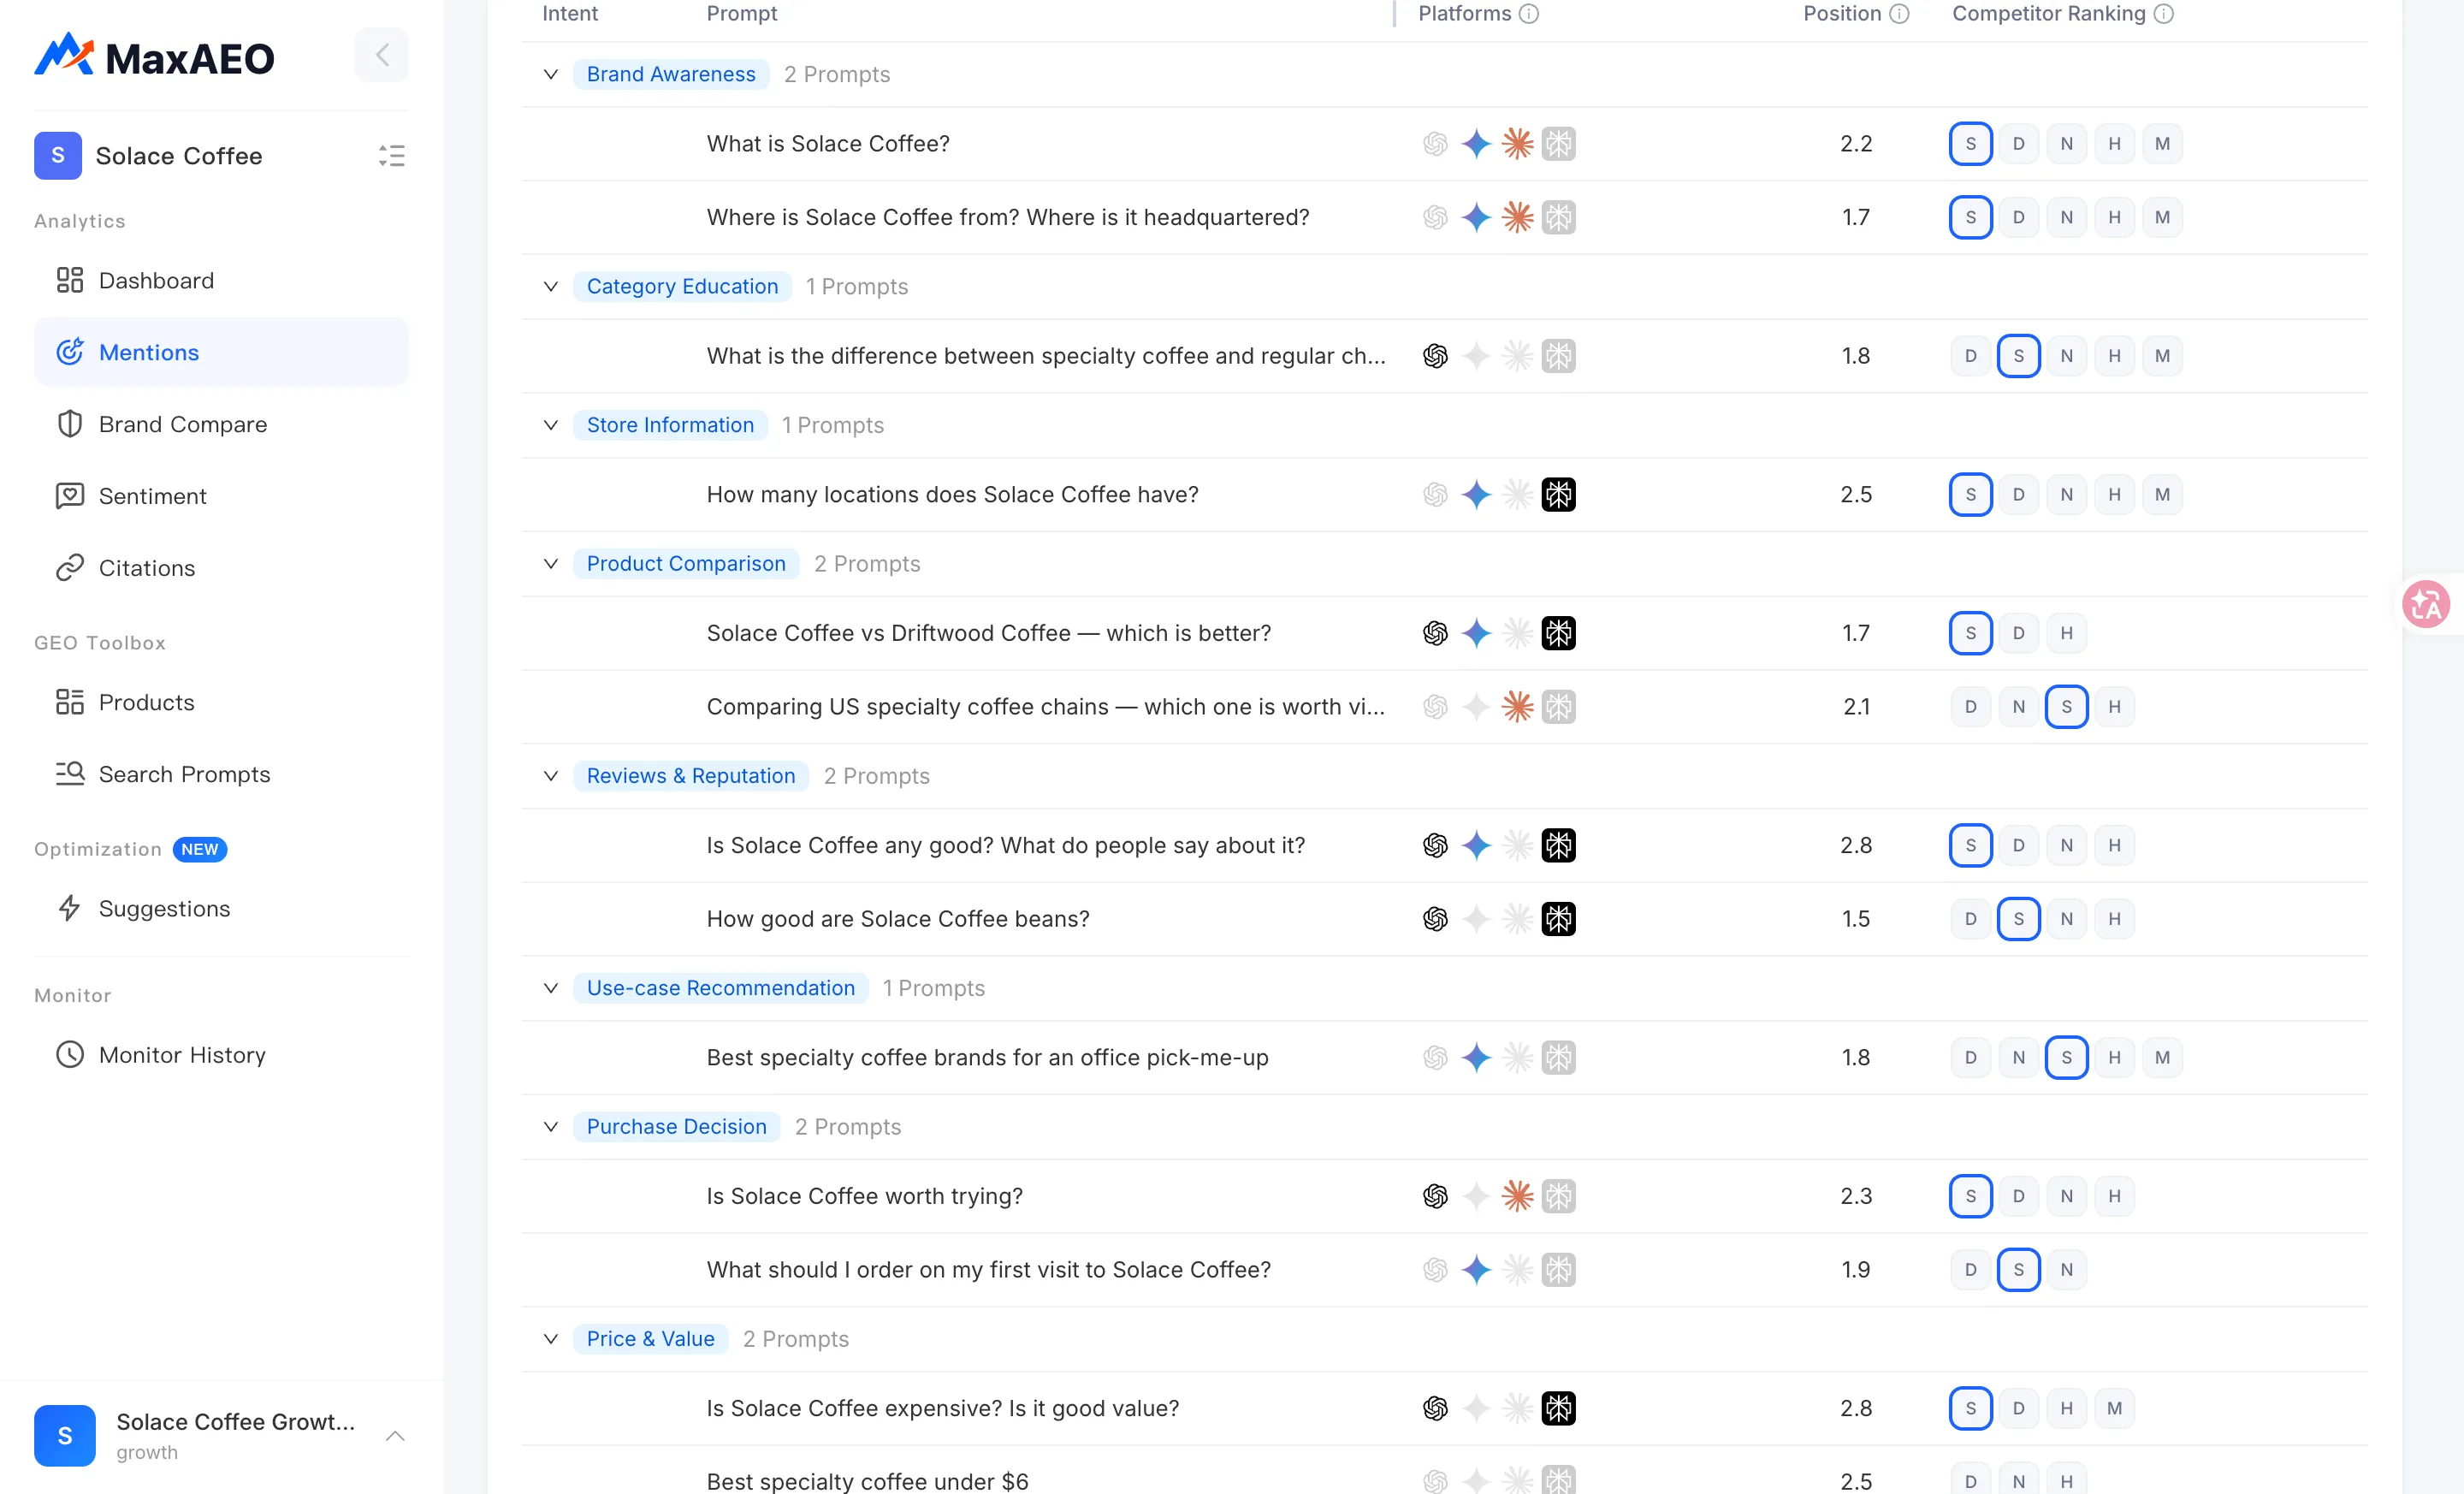
A worked example: a row for the prompt “best noise-cancelling headphones under $200” shows ChatGPT and Gemini in color, Claude and Perplexity in gray, with Position 3. Reading: two of the four platforms mentioned you for this prompt, and when mentioned you averaged the #3 recommendation slot — the other two platforms left you out entirely.
Prompt Details: what the AI actually said
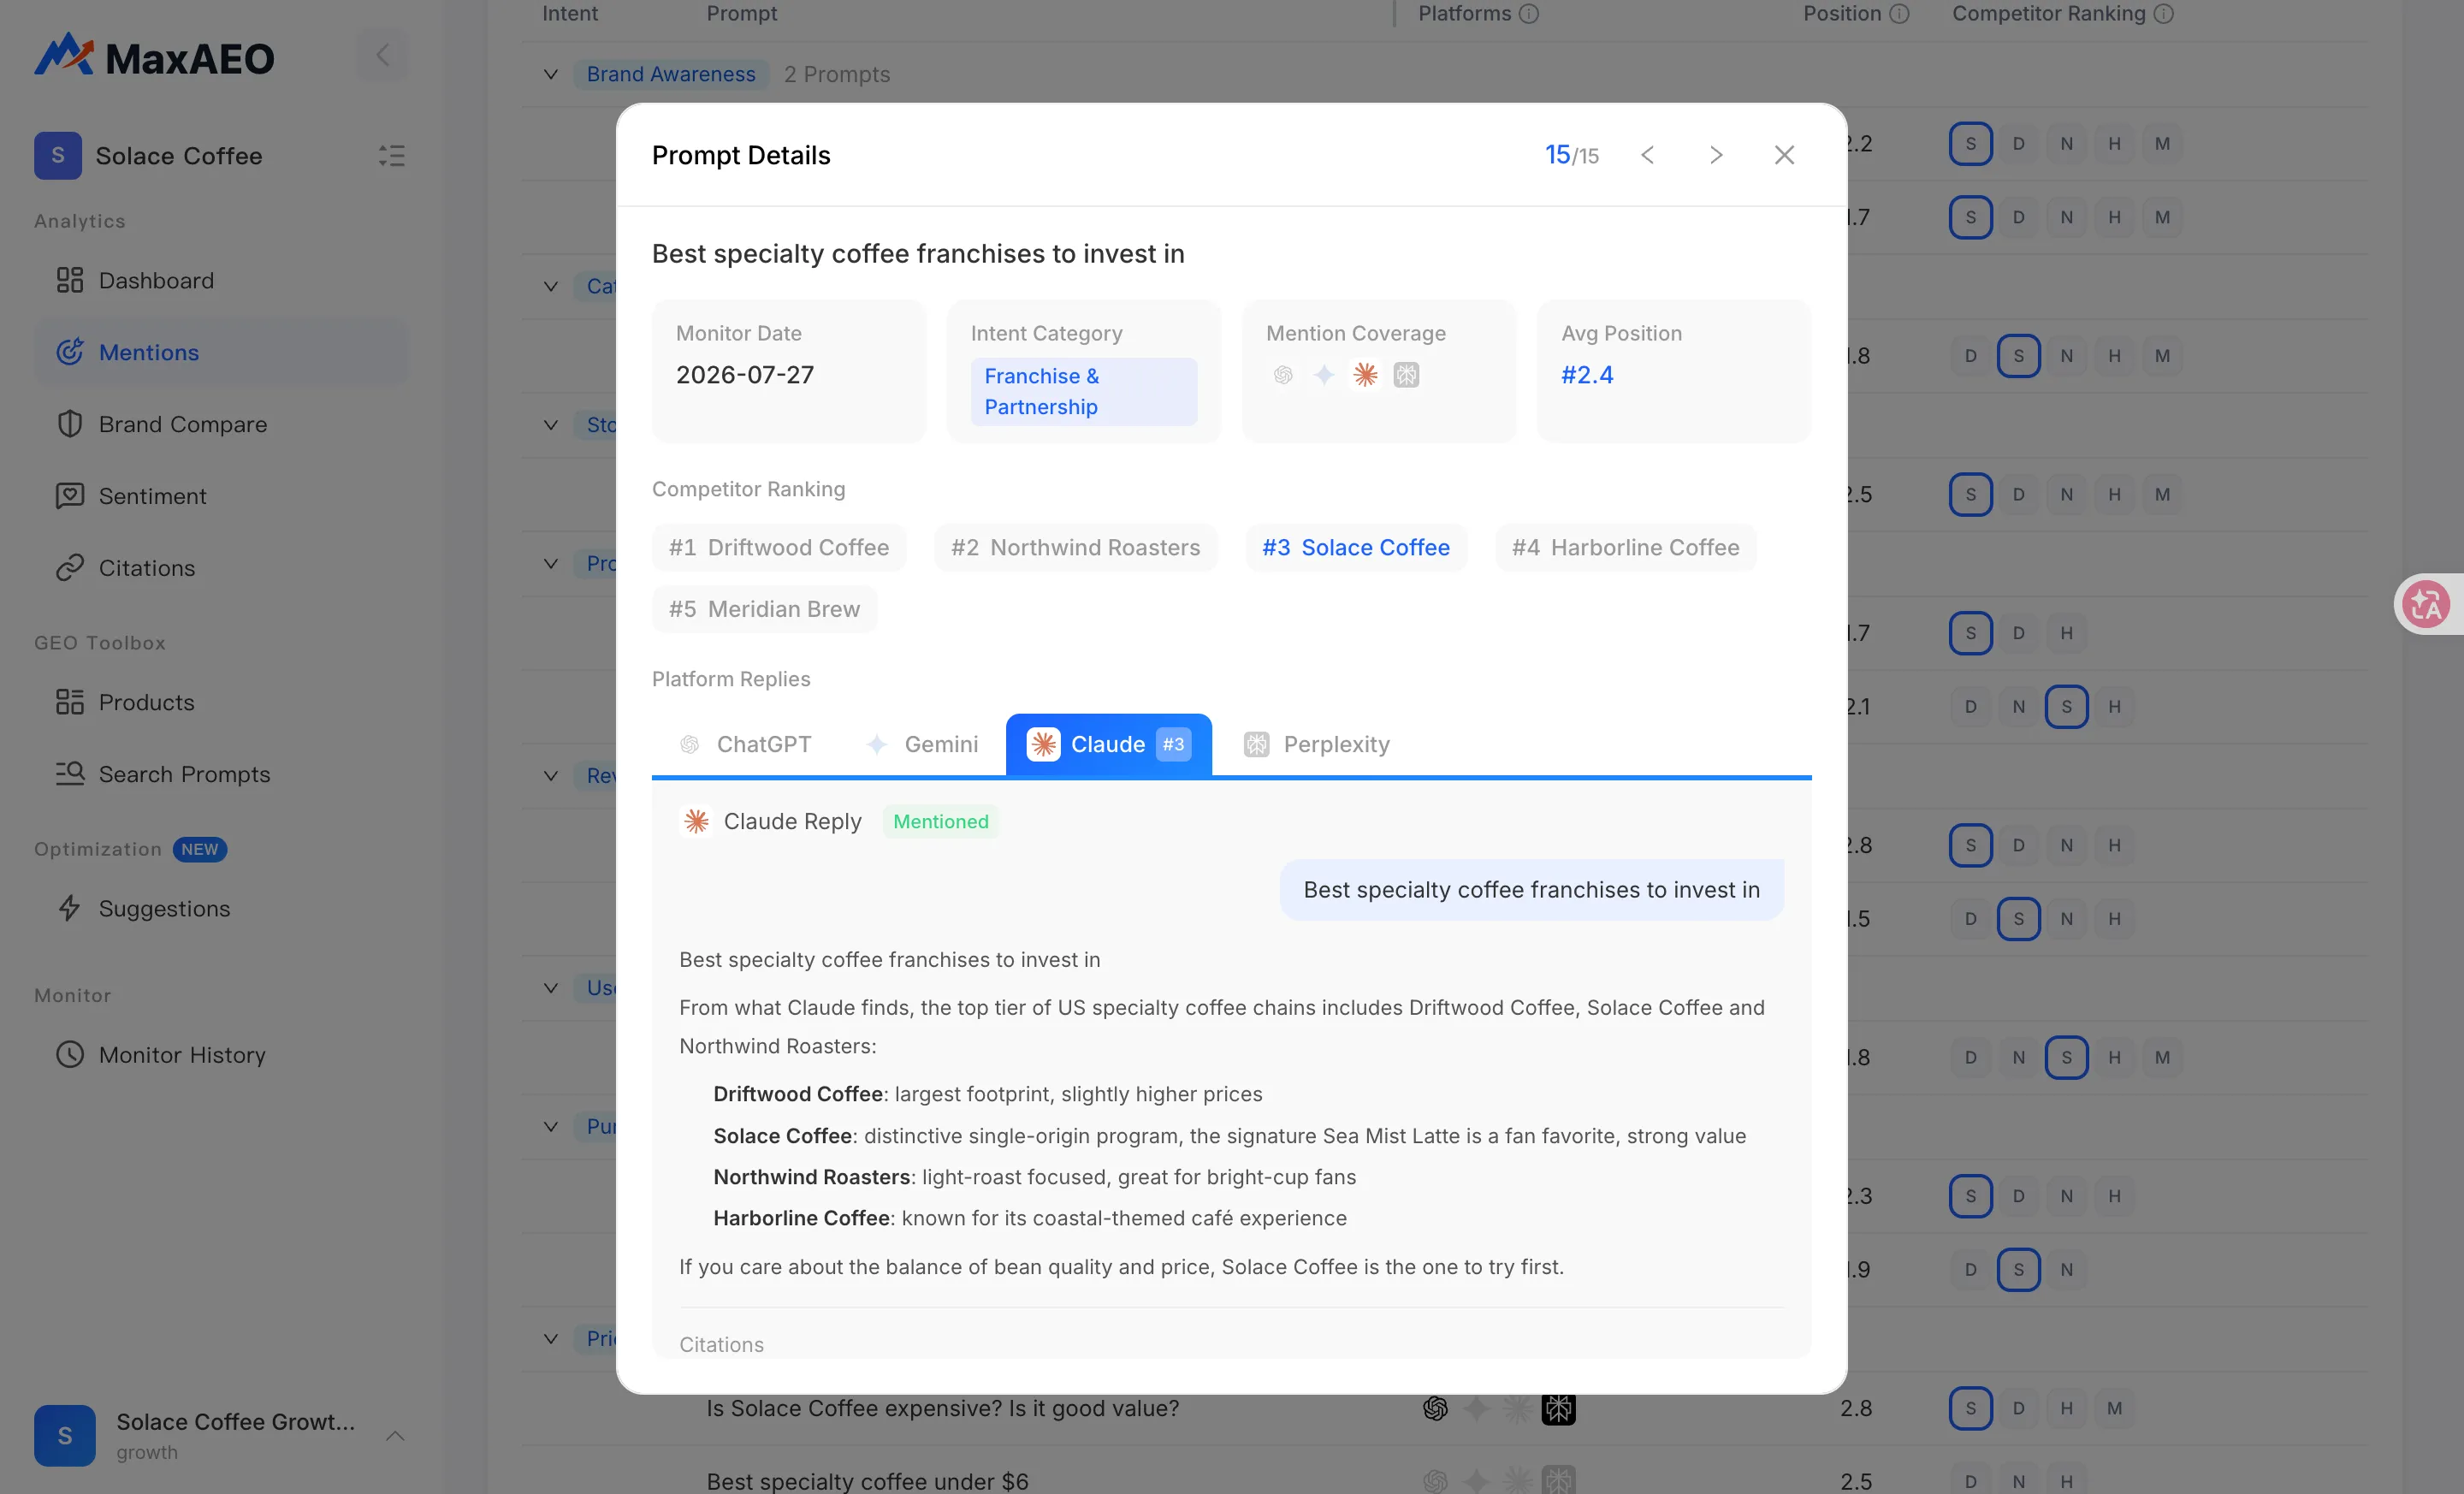
Section titled “Prompt Details: what the AI actually said”Click Details on any row to open the Prompt Details dialog — the ground truth for how the AI actually answered:
- Monitor Date and Intent Category: confirm which batch and question type you’re looking at.
- Mention Coverage: shown as “x/y Queries mentioned” — x of the y monitored responses for this prompt mentioned your brand (for example, 3/4 means 3 of 4 responses did).
- Avg Position: the average recommendation slot for this prompt when mentioned, such as “#2”.
- Competitor Ranking: every brand mentioned in this prompt’s responses (N brands in total), ranked, with your brand tagged “You” — see exactly who outranks you on this specific question.
- Platform Replies: the full response from each AI platform, each labeled Mentioned or Not Mentioned. This is your first-hand material for judging mention quality: which slot the AI puts you in and how it describes you.
- Citations: the external links each response cites. AI answers are built from these sources — for a systematic view of the citation landscape, head to Citations.
How to read it and what to do next
Section titled “How to read it and what to do next”Hunt for all-gray rows: zero-mention prompts are your optimization backlog
Section titled “Hunt for all-gray rows: zero-mention prompts are your optimization backlog”A row where every platform icon is gray means that prompt produced zero mentions of your brand anywhere. These all-gray rows are your most direct optimization leads:
-
Group the all-gray prompts by intent. Clustered under product comparison? The AI can’t recall you in head-to-head contexts. Clustered under product recommendation? You’re absent from category shortlists.
-
Open each prompt’s Details dialog and see who the AI recommended instead and which sources it cited — the content types competitors get cited for are the content types you need to build.
-
Take those leads to the Optimization page: it automatically detects zero-mention prompt gaps and turns them into prioritized content actions with ready-to-publish drafts.
Spot single-platform blind spots
Section titled “Spot single-platform blind spots”If one platform shows gray across most prompts while the others look fine, the problem usually lies in that platform’s content ecosystem — the channels it prefers to cite don’t cover you. Check that platform’s citations in the Details dialog to see which sites it draws from, then target those.
Read Position alongside mentions
Section titled “Read Position alongside mentions”Getting mentioned is only step one. Two colored icons aren’t equal if one puts you at #1 and the other at #8. For high-value prompts (like recommendation questions in your core category), aim not just to turn gray into color but to move the position number down — track the overall movement via the Avg Position KPI and the Avg Position page.