
Dashboard
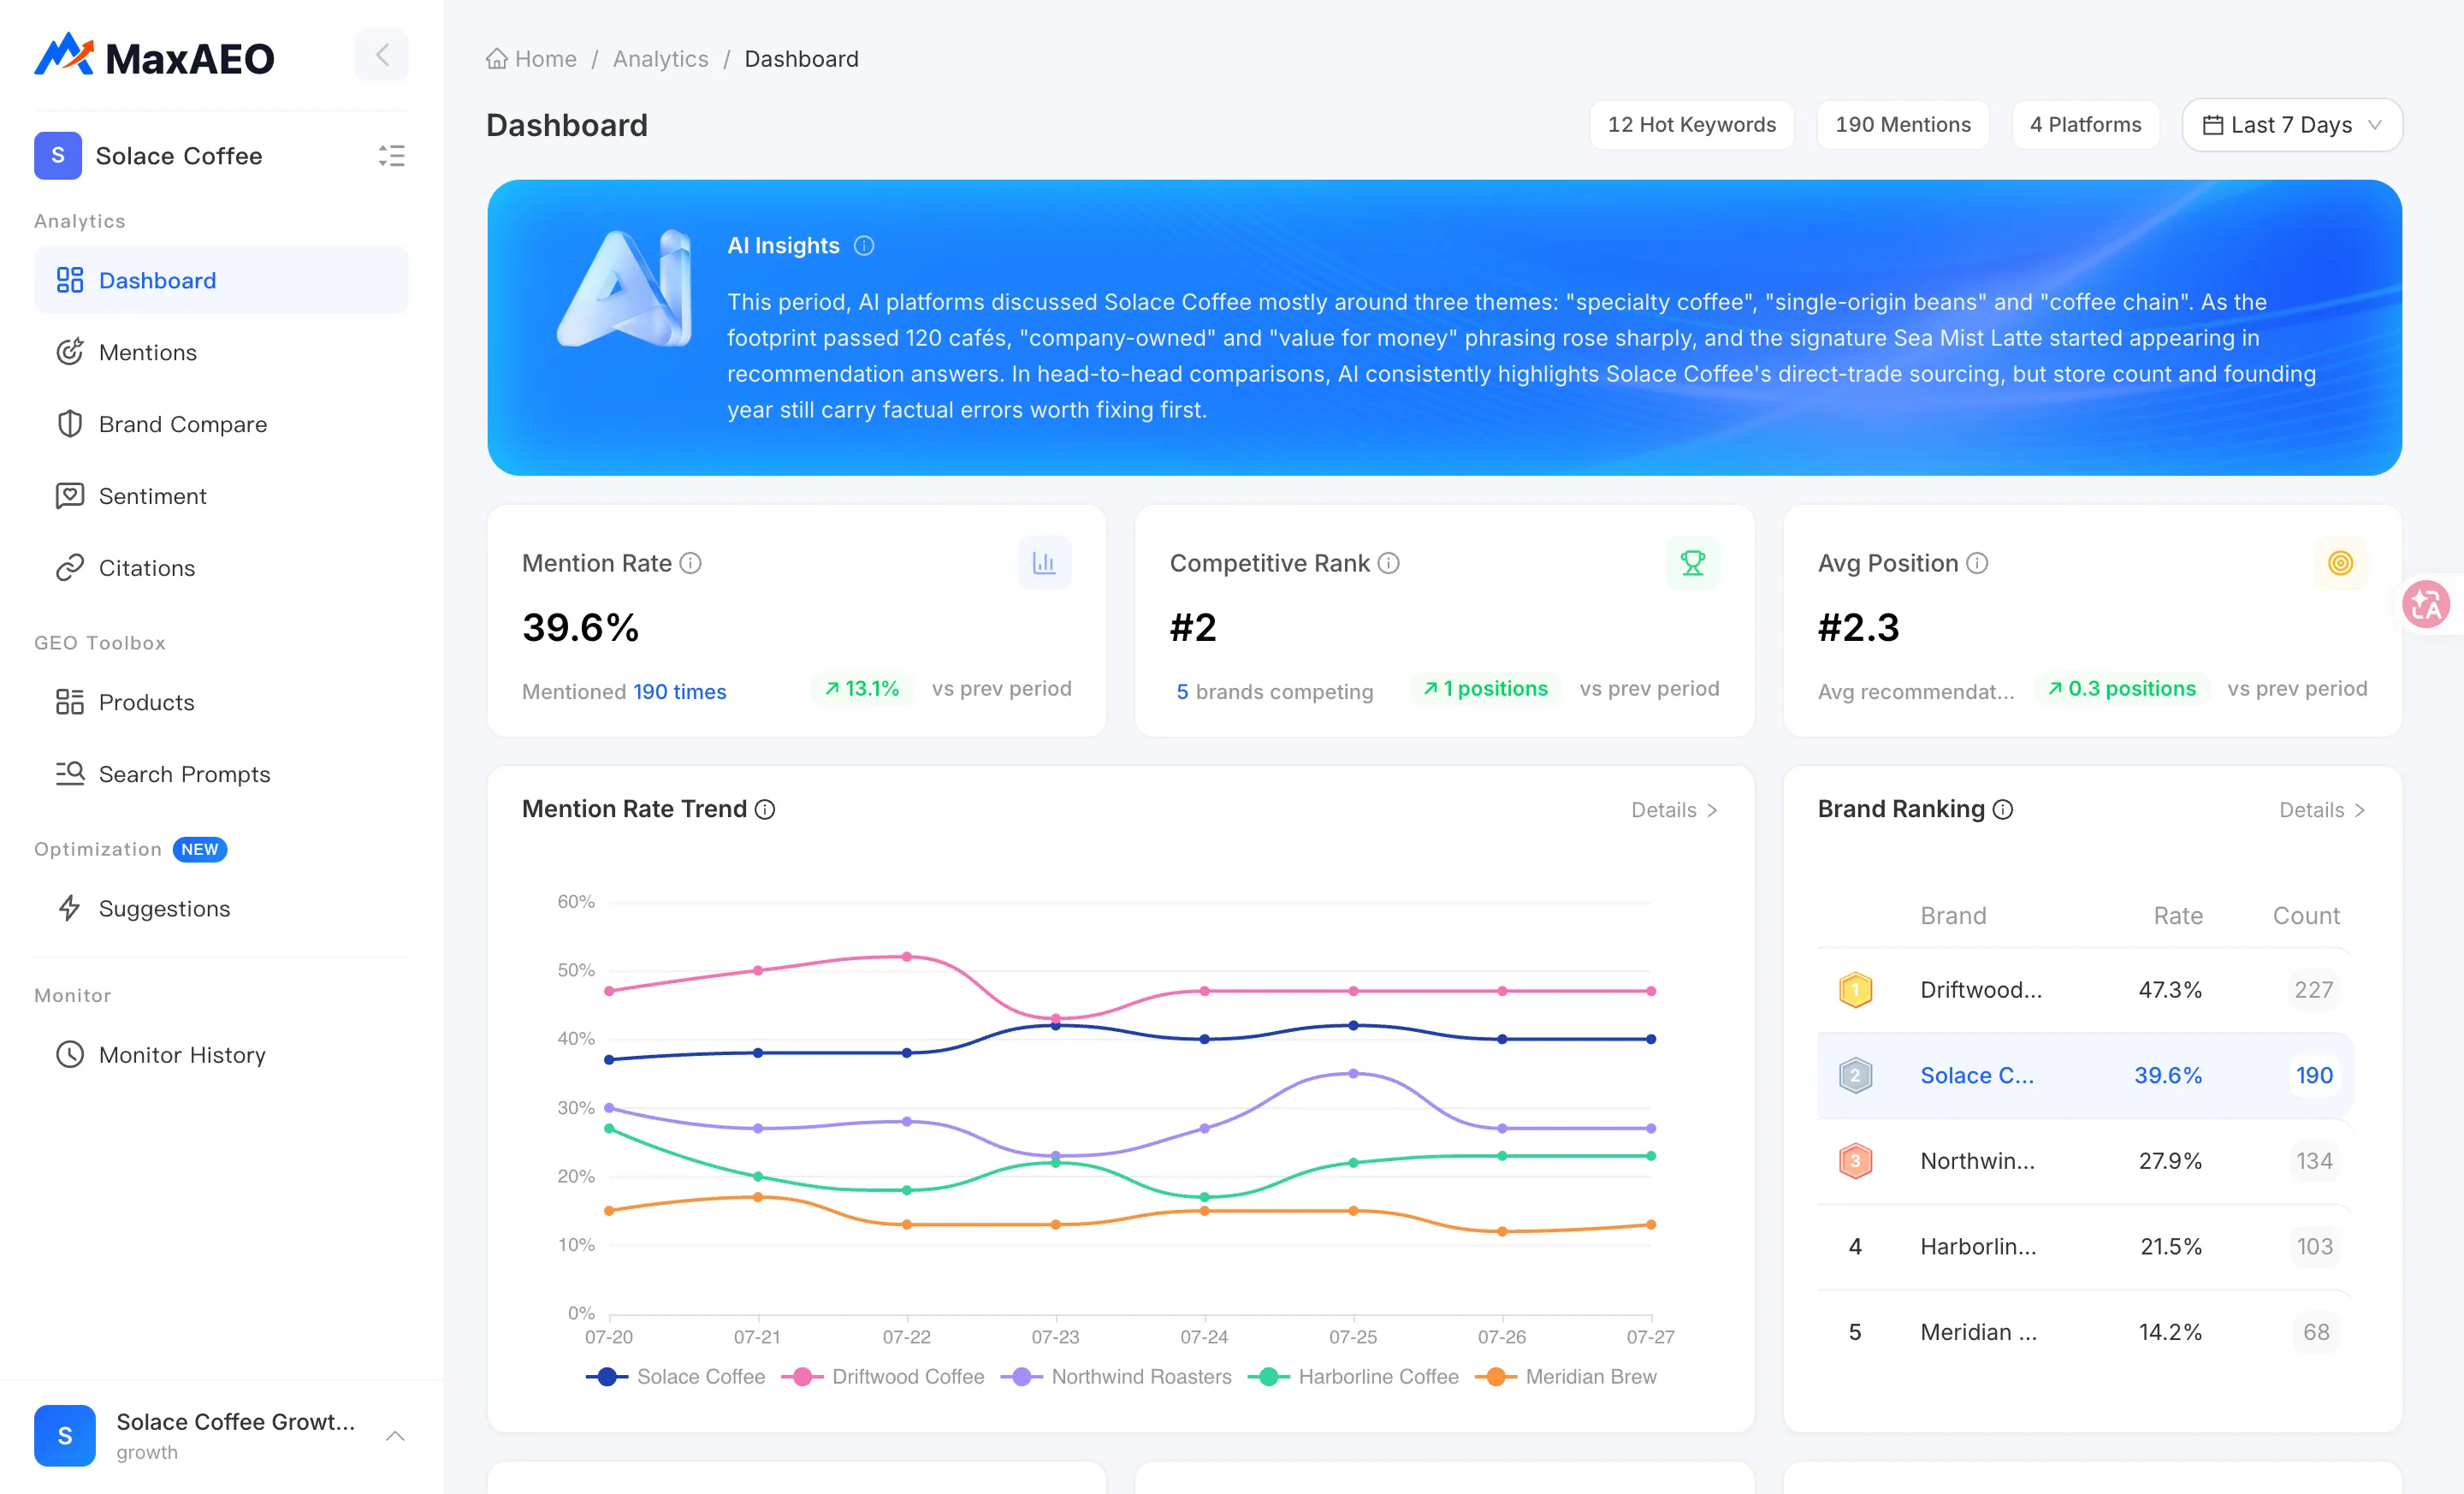
The Dashboard is the first page you see after signing in to MaxAEO. It condenses one project’s monitoring results for the selected time range onto a single screen: three KPI cards at the top answer “does AI mention you, where do you rank against competitors, and how high up the list do you appear,” and the modules below break the picture down into trends, rankings, platforms, sentiment, keywords, and citation sources.
Why you need it
Section titled “Why you need it”Daily automated monitoring produces a large volume of AI responses — reading them one by one is neither realistic nor necessary. The Dashboard’s job is to lead with conclusions and offer entry points: spend a minute or two scanning this page each day to judge whether your brand’s AI-search performance is improving or slipping and which module the change is coming from, then jump into the Mentions, Sentiment, or Citations pages when you need to dig deeper.
Global filters
Section titled “Global filters”The question it answers: which project and which time window am I looking at right now?
Two controls set the scope for the entire page — every KPI and chart updates when you change them:
- Project switcher: the Dashboard shows one project at a time. If you manage multiple projects on a plan like Pro, switch to the right project in the top-left sidebar before reading anything below.
- Time range: Last 7 Days, Last 14 Days, Last 30 Days, or Last 90 Days. Longer ranges smooth out the day-to-day noise that comes from AI response randomness.
The AI platforms included in the numbers are the monitoring platforms you enabled for this project in Products (see Platforms); to inspect a single platform, use the Platform Performance module below.
AI Insights
Section titled “AI Insights”The question it answers: what’s the single most important thing in this period’s data?
The AI Insights card surfaces key findings and recommendations automatically generated by AI from this period’s monitoring data — a sharp Mention Rate move, an unusual result on one platform, and so on. Treat it as a reading guide for the page: start with the insight, then verify it against the charts below. When there isn’t enough data yet, the card shows “No AI insights available” — that’s expected.
The three KPI cards
Section titled “The three KPI cards”The question it answers: what are my three core AI-search outcomes right now, and are they better or worse than last period?
Each card carries a vs prev period change indicator (compared against the preceding window of equal length) — your first signal of direction:
- Mention Rate: the percentage of monitored AI responses that mention your brand, with the number of times you were mentioned. This is MaxAEO’s core metric; see Mention Rate.
- Competitive Rank: where your Mention Rate ranks among all monitored brands, shown as “N brands competing.” For example, ranking 2nd of 6 means only one competitor gets recommended more often than you. See Competitive Rank.
- Avg Position: your average recommendation position when mentioned — lower is better. A value of 2.5 means you typically appear 2nd or 3rd in the list. See Avg Position.
Mention Rate Trend
Section titled “Mention Rate Trend”The question it answers: which direction are my rate and my competitors’ rates moving over this window?
The Mention Rate Trend line chart plots your brand and your competitors on the same axes, day by day across the selected range. What matters here is relative movement, not absolute values: if you’re climbing while competitors hold flat, your optimization is working; if everyone rises and falls together, it’s more likely platform-wide fluctuation. Click Details to jump to the Mentions page, which breaks the data down by monitoring batch.
Brand Ranking
Section titled “Brand Ranking”The question it answers: what does the recommendation landscape for my category look like in AI’s eyes?
The Brand Ranking table lists every monitored brand — yours plus competitors — sorted by Mention Rate, with rate and count for each, and your own brand highlighted as Self. It’s the expanded view behind the Competitive Rank KPI: it tells you not just where you rank but how big the gap is to the brands above and below. A narrow gap can flip with one round of content work; a wide one calls for sustained investment. For richer multi-brand analysis (platform heatmap, influence bubble chart), head to Brand Compare.
Platform Performance
Section titled “Platform Performance”The question it answers: on which AI platforms is my brand strong, and where is it weak?
Platform Performance compares your brand’s Mention Rate on each AI platform. Platforms draw on different training data and sources, so variation is normal: a 60% rate on ChatGPT alongside 15% on Perplexity marks the weaker platform as a clear optimization target. Use the platform filter on the Optimization page to pick up matching action items.
Sentiment Overview
Section titled “Sentiment Overview”The question it answers: when AI mentions me, is it saying good things or bad things?
Sentiment Overview shows the tone distribution of AI responses about your brand: Positive / Neutral / Negative. Getting mentioned is only step one — the tone of the mention shapes user decisions just as much. If the negative share climbs, open the Sentiment page to read the actual negative responses, the negative word cloud, and the information-gap list to pin down exactly what AI is saying. For how sentiment is scored, see Sentiment Score.
Hot Keywords
Section titled “Hot Keywords”The question it answers: which words does AI most often associate with my brand?
Hot Keywords displays the high-frequency terms AI responses attach to your brand as tags, with the keyword count and each term’s mention count. It’s a snapshot of how AI “thinks” about you: your core selling points showing up here means your messaging is landing; a term you’d rather not be associated with is worth tracing on the Sentiment page.
Citation Overview
Section titled “Citation Overview”The question it answers: which websites is AI pulling its information about my brand from?
Citation Overview shows the distribution of external sources cited in AI responses: the top sources by citation count, with the remainder rolled up as “N more from other sources.” This is key to understanding why AI says what it says — its answers largely follow what it cites. The most-cited sources are your highest-priority placement targets; the full source analysis with per-article detail lives on the Citations page.
A suggested daily routine
Section titled “A suggested daily routine”Treat the Dashboard as a one-to-two-minute daily sweep rather than a number-by-number vigil:
- Read AI Insights first — see what AI has already flagged.
- Scan the vs prev period arrows on the three KPI cards for overall direction.
- When something moved, drill down by module: mention issues go to Mentions, reputation issues to Sentiment, source issues to Citations.
- Once you’ve confirmed the problem, collect matching action items on the Optimization page.