AI visibility sample size is the number of prompts, repeat runs, and engines needed for a brand mention rate to carry a usable margin of error. For a portfolio-level number, that is roughly 150–200 prompts run 3 times each, per engine, per period — about 450–600 answers, landing near ±5 percentage points.
Running 20 prompts 30 times each costs exactly the same and lands at ±15pp. Same budget, three times worse.
That gap is the whole problem. Most teams pick a prompt count from a blog post, a repeat count from a vendor default, and never check what the combination is worth. This piece gives you the arithmetic, the data behind it, and a copyable design.
Jump to what you need: the formula · our 23,040-answer study · prompts vs runs at fixed budget · detecting change · recommended designs
Why an AI visibility number is a sample, not a measurement
A mention rate is an estimate drawn from a random process, not a fact you read off a screen. Each answer is one Bernoulli trial: your brand appears or it doesn't. Run the same prompt again and the coin lands differently.
This is not a bug in the tooling. Sampling temperature, retrieval index churn, model version rollouts, and platform-side experiments all move the output. A variance-components study of non-determinism in LLM brand answers decomposed 12,933 responses and found within-prompt resampling accounted for 34.8% of total variance, brand-in-context interaction 29.6%, and query language 26.5%. Brand identity itself — the thing you are trying to measure — was 1.5%.
Read that last number twice. The signal you care about is a thin slice of what any single answer contains. Everything else is context, phrasing, and noise. Which is why AI visibility sample size is a budgeting decision, not a preference.
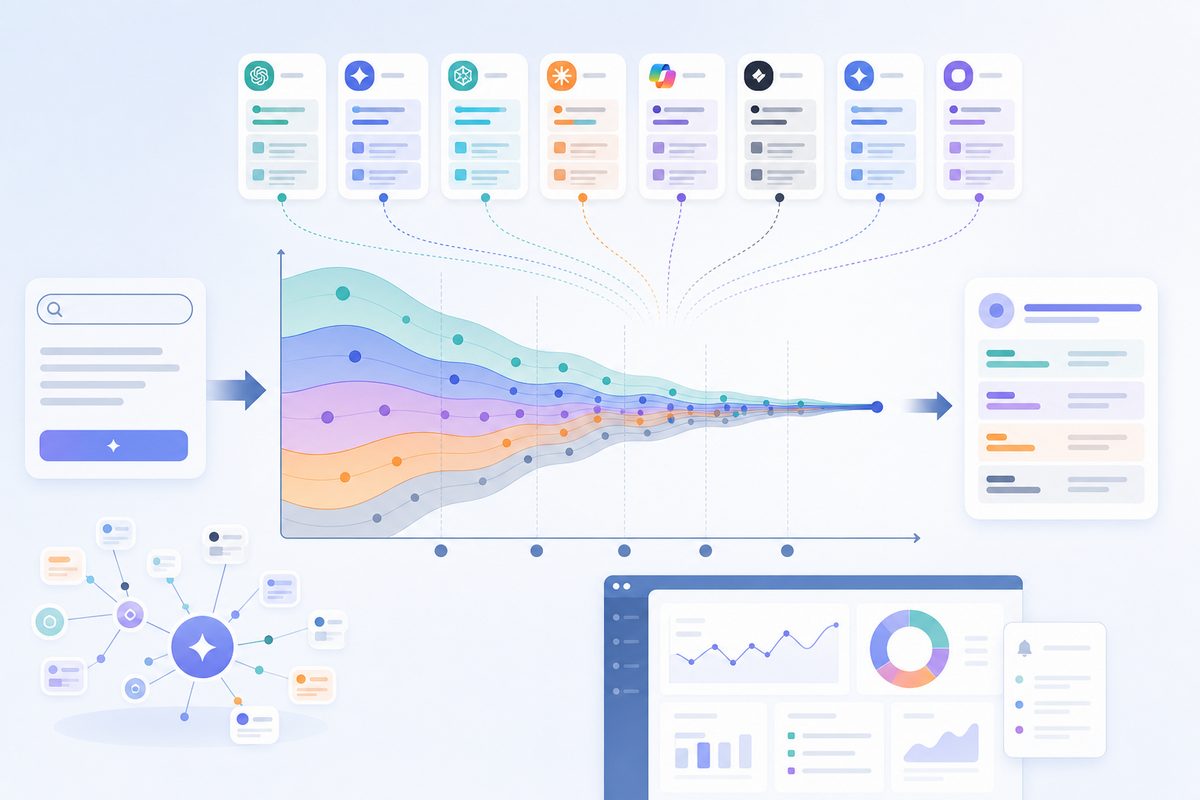
The formula every AI visibility dashboard should be running
For a mention rate p̂ measured over n answers, the 95% margin of error is:
MoE = 1.96 × √(p̂(1 − p̂) / n)
Precision improves with the square root of n, which has one brutal consequence: halving your margin of error requires four times the data.
| Answers (n) | MoE at 30% mention rate | MoE at 50% |
|---|---|---|
| 30 | ±16.4pp | ±17.9pp |
| 50 | ±12.7pp | ±13.9pp |
| 100 | ±9.0pp | ±9.8pp |
| 200 | ±6.4pp | ±6.9pp |
| 400 | ±4.5pp | ±4.9pp |
| 1,000 | ±2.8pp | ±3.1pp |
Use the Wilson score interval rather than this simple form when rates sit near 0% or 100%, which in AI search monitoring they constantly do. The naive formula says 0 mentions in 20 runs means 0% with zero uncertainty. Wilson correctly returns 0–16.1%. The shortcut — the rule of three — puts the 95% upper bound after zero events at about 3/n: zero mentions in 20 runs is consistent with a true rate as high as 15%.
Practical translation: "we have no AI visibility" is an unsupportable claim below about 60 runs.
What we measured: 23,040 answers across 6 engines
To size this properly we ran a stability study, not a benchmark. Method:
- 18 B2B SaaS brands, 320 tracked prompts (~18 per brand)
- 6 engines: ChatGPT, Gemini, Perplexity, Claude, Copilot, Google AI Mode
- 12 repeat runs per prompt × engine, spread across a 14-day window
- 23,040 answers total, parsed for brand mentions and cited domains
Headline findings:
- 34% of prompts returned an identical brand shortlist on all 12 runs
- 41% flipped the tracked brand in or out at least once
- Of the flippers, 68% had observed rates between 20% and 80% — the maximum-variance zone
- A single run disagreed with the same prompt's 12-run majority verdict 19% of the time
That last figure is the one to take to a stakeholder meeting. Roughly one in five single-run readings points the wrong direction. If your weekly report is built on one pass per prompt, a fifth of the red cells are wrong — and so are a fifth of the green ones.
One caveat on scope, because it changes how you read the rest: these are B2B SaaS category prompts ("best X software for Y"), where shortlists are long and competition is dense. High-volume consumer queries with two or three dominant brands sit closer to 0% or 100%, stabilise faster, and need less depth. Sizing guidance that ignores where your rates actually sit will over- or under-budget you.
Repeat runs are not independent samples
Here is where most AI visibility sample size guidance breaks. Twelve runs of one prompt are not twelve independent observations of your brand's visibility. They are twelve draws from a single prompt's distribution — a cluster sample, where prompts are clusters and runs are observations inside them.
Survey statistics has handled this for decades with the design effect:
Deff = 1 + (m − 1) × ICC, where m = runs per prompt and ICC = intra-cluster correlation
n_eff = total answers ÷ Deff
In our data, median within-prompt ICC was 0.57, varying sharply by engine:
| Engine | Within-prompt ICC | Reading |
|---|---|---|
| Perplexity | 0.73 | Retrieval-anchored, most repeatable |
| Copilot | 0.66 | Bing index dependency stabilises output |
| Claude | 0.60 | Moderate |
| ChatGPT | 0.54 | Moderate |
| Google AI Mode | 0.49 | Query fan-out adds variance |
| Gemini | 0.44 | Least repeatable of the six |
The pattern is mechanical: the more an engine anchors on live retrieval, the more it repeats itself. Perplexity resolves a query to a document set and paraphrases it, so run-to-run drift is small — which is also why earning citations in Perplexity is a source-side problem more than a prompt-side one. Gemini leans further on parametric generation and fans out subqueries, so the same input reaches different documents. Practical consequence: a design that hits ±5pp on Perplexity will miss it on Gemini. Size to your weakest engine, not the average, and never blend six engines into one score that hides a 0.29 spread in repeatability.
Now apply the math. At ICC 0.57, 20 prompts × 30 runs = 600 answers carries a design effect of 17.5. Effective sample: 34. You paid for 600 and received 34.
The ceiling nobody mentions: k ÷ ICC
Push m toward infinity in the design-effect formula and n_eff converges to k ÷ ICC, where k is your prompt count. This is a hard ceiling.
At ICC 0.57:
- 20 prompts → maximum effective sample of 35, forever
- 50 prompts → 88
- 100 prompts → 175
- 200 prompts → 351
No number of repeat runs gets 20 prompts past an effective sample of 35. And you arrive there fast: at 30 runs, 20 prompts have already captured 97% of everything repeat-running would ever deliver. Run each prompt a thousand times and you buy the remaining 3%.
This resolves a live contradiction in the published guidance. Evertune's repetition analysis recommends 100 repetitions per prompt, reporting roughly ±27pp at 5 runs, ±12pp at 12, and ±6pp at 100. The variance-decomposition work concludes the opposite: past about the fifth repeat, additional runs cut relative-error variance by a rounding error.
Both are right, because they answer different questions.
Evertune is estimating one prompt's true rate, where repeats are the only available lever. Their numbers hold up under audit: at a ~10% mention rate, the binomial formula predicts ±26.3pp at n=5 and ±5.9pp at n=100, against their reported 27 and 6. Going from 5 to 100 runs is a 20× increase, so precision should improve by √20 = 4.47×; 27 ÷ 4.47 = 6.04. Textbook. (Their 12-run figure is tighter than theory permits — which is what a single observed sample does versus an expected value.)
The variance study is estimating a brand-level score across a portfolio, where between-prompt variance dominates and repeats are the worst dollar you can spend.
Repeats buy per-prompt certainty. Prompts buy portfolio certainty. Decide which number goes in the report, then allocate. A vendor recommending 100 repetitions is not wrong; they are answering the per-prompt question while you are asking the portfolio one.
More prompts or more runs? A fixed-budget comparison
Hold the budget at 600 answers per engine per period and vary only the split. ICC 0.57, mention rate 30%:
| Design | Deff | Effective n | 95% MoE |
|---|---|---|---|
| 20 prompts × 30 runs | 17.5 | 34 | ±15.4pp |
| 50 prompts × 12 runs | 7.3 | 83 | ±9.9pp |
| 100 prompts × 6 runs | 3.9 | 156 | ±7.2pp |
| 200 prompts × 3 runs | 2.1 | 280 | ±5.4pp |
| 300 prompts × 2 runs | 1.6 | 382 | ±4.6pp |
Identical cost. 3.3× spread in precision, from allocation alone.
The reason to stop short of 1 run per prompt — which maximises raw precision — is that you then lose the ability to see per-prompt volatility at all, and you inherit that 19% single-run misclassification rate on every diagnostic. Three runs is the practical floor: enough to flag instability, cheap enough to fund 200 prompts.
For assembling a set that large without padding it, our companion piece on sizing an AI visibility test you can trust covers prompt sourcing, and the audit prompt construction guide covers category balance.
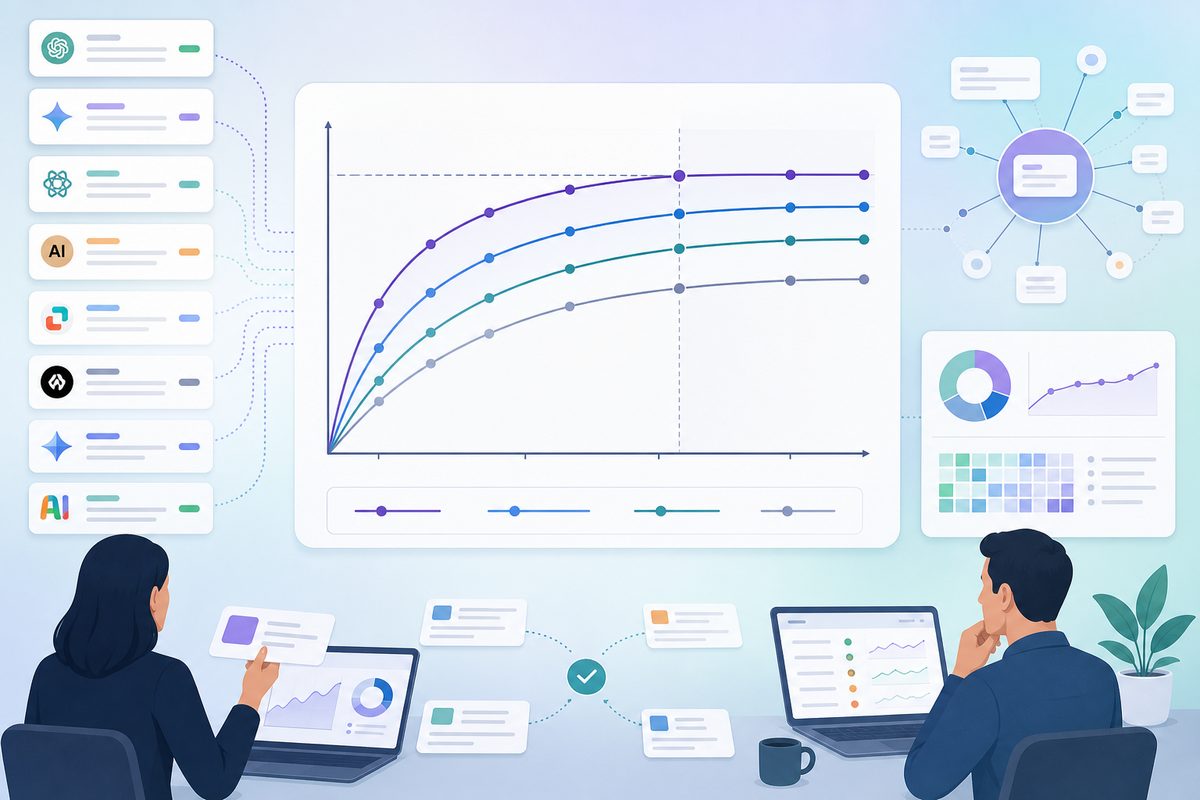
How many runs before you trust a single prompt's verdict?
Answer: 9 runs gets you to ~90% confidence if the prompt's true rate is 70% — and no run count rescues a prompt sitting near 50%.
Probability that a majority vote across m runs matches the prompt's true side:
| True mention rate | 5 runs | 9 runs | 15 runs | 25 runs |
|---|---|---|---|---|
| 60% | 68% | 73% | 79% | 85% |
| 70% | 84% | 90% | 95% | 98% |
| 85% | 97% | 99% | >99% | >99% |
Prompts at 85% stabilise almost immediately. Prompts at 60% are still coin-flippy at 25 runs. The implication is a tiered design, not a uniform one:
- Run the whole portfolio at 3 runs for the level estimate.
- Flag every prompt whose observed rate lands between 20% and 80%.
- Re-run only the 15–25 borderline, revenue-relevant prompts at 9–12 runs.
- Report tier 1 as your number; use tier 2 for diagnosis, never for the headline rate.
You spend deep repeats exactly where the ambiguity lives, and the extra cost is roughly 200 answers — a third of a standard weekly budget.
Sample size for deep research and agentic modes
One assumption in everything above is that a prompt produces one answer. Deep research modes break it. A single request fans out into dozens of subqueries, reads and re-reads sources, and returns a synthesis assembled from a much wider document pool — so run-to-run variance comes from which documents got retrieved, not just from token sampling.
Three consequences for sizing:
- ICC drops. Wider retrieval means less repeatable output, so the design effect penalty shrinks and each repeat buys more than it does in a standard chat answer. Where a fast-mode prompt might sit at 0.6, expect agentic modes lower.
- Cost per answer rises 10–50×. A deep research run can take several minutes and consume far more tokens than a chat completion. A 600-answer weekly budget in fast mode is not a 600-answer weekly budget here.
- The unit of measurement changes. Being mentioned in a 4,000-word research synthesis is not the same event as making a five-item shortlist. Track them as separate metrics; do not pool them into one mention rate.
Practical design: keep the portfolio-level baseline on standard modes where answers are cheap, and run a small, frozen 20–30 prompt panel monthly against deep research modes to watch for divergence. Our breakdown of how multi-step agents change which brands get cited covers what actually shifts in those answers.
When does adding prompts stop improving precision?
Two ceilings arrive, and the second one hits first.
Statistically, MoE shrinks with 1/√k. Going 50 → 100 prompts cuts it 29%; 100 → 200 cuts another 29%. It never stops helping, it just stops being worth the invoice.
Validity binds sooner. Past a certain point you are adding prompts nobody actually types. Those prompts do not merely dilute the estimate — they change what you are measuring, dragging the number toward whatever your marginal, low-demand queries look like. A 500-prompt set where 300 are invented is less accurate than a 150-prompt set that mirrors real buying language.
Our stopping rule, derived from watching portfolio rates settle as we added prompts in blocks of 20:
| Prompt set grows | Portfolio mention rate moves |
|---|---|
| 40 → 60 | 4.8pp |
| 100 → 120 | 2.1pp |
| 180 → 200 | 0.9pp |
Stop when two consecutive blocks of 20 move the portfolio rate by less than half the current margin of error. At 200 prompts × 3 runs, MoE is ±5.4pp, half is 2.7pp, and observed movement was 0.9pp. The set had converged. For most B2B SaaS categories that lands between 150 and 200 prompts.
Detecting change: the sample size nobody budgets for
This is where AI visibility sample size planning usually collapses, because reporting a level and detecting a change are different problems with wildly different requirements.
Effective observations needed per period to detect a lift from a 30% baseline (α = 0.05, 80% power), and the raw answers that implies at 200 prompts × 3 runs:
| Lift to detect | Effective n per period | Raw answers per period |
|---|---|---|
| +3pp | 3,759 | 8,044 |
| +5pp | 1,374 | 2,940 |
| +10pp | 353 | 755 |
| +15pp | 160 | 342 |
| +20pp | 90 | 193 |
At 600 answers per period you can detect a 15pp swing. You cannot detect 10pp, and 5pp is nowhere near reach. Most week-over-week movement in an AI visibility tool is noise being narrated as strategy.
The paired design that cuts the requirement by 3×
The same prompt-level correlation that punished you in the design effect now works for you. Because you re-run the same prompt set each period, treat it as a paired comparison: the variance of a paired difference scales with (1 − ρ), where ρ is the week-over-week per-prompt correlation.
We observed ρ = 0.68, giving a variance multiplier of 0.32 — a 3.1× reduction in required sample.
- 10pp detection: 353 → 113 effective observations (~242 raw answers)
- 5pp detection: 1,374 → 440 effective (~941 raw answers)
Suddenly a 600-answer weekly budget detects a 10pp move comfortably. Three conditions apply:
- Freeze the prompt set. Adding or dropping prompts mid-comparison changes what you are measuring, and the delta absorbs the composition change.
- Freeze the engine mix. ICC ranges 0.44–0.73 across engines; shifting the blend moves the aggregate without any visibility changing.
- Analyse prompt-by-prompt deltas, not two aggregate percentages. The pairing lives at the prompt level; comparing two headline numbers throws it away.
Break any one and you are back to the unpaired column.
Pairing tells you a change occurred. It does not tell you what caused it — for that you need to trace which sources moved, which is a citation-tracking problem rather than a sample-size one. Sample size is necessary for causal claims, never sufficient.
The segment trap
Your portfolio n is healthy. Then someone filters the dashboard to ChatGPT × mid-market × comparison prompts and reads a number off a cell containing 8 answers. Its Wilson interval is roughly ±33pp.
Two rules:
- Minimum 30 effective observations per reported cell. Below that, show the count and suppress the percentage.
- Never claim an effect smaller than the cell's interval width. If the interval is ±12pp and the movement is 6pp, there is no movement.
Segmentation multiplies fast — 6 engines × 4 topics × 3 personas is 72 cells. A 600-answer budget leaves ~8 answers each. Segment on one dimension at a time, or fund the dimension you actually intend to slice. This is the most common failure mode we see when auditing whether an AI visibility tool's numbers can be trusted.
What sample size cannot fix
Sample size buys precision. It buys nothing against bias, and four biases are common enough to check before you spend on more runs:
- Prompt-set bias. A set skewed toward your strengths reports a rate about your prompt selection, not your visibility. Sample prompts from search demand and sales-call language, not from a brainstorm.
- Parsing bias. Substring matching counts "Notion" inside "notionally" and misses a brand written as an unlinked product name. Audit your matcher against 100 hand-labelled answers before trusting any rate; a 5% parsing error dwarfs the precision you bought with 400 extra answers.
- Personalisation and geography. Logged-in sessions, location, and account history all shift answers. Fix the account state and locale, and record them as part of the design line.
- Position bias. Being named 8th in a list of 10 counts identically to being the sole recommendation in a naive mention rate. If ranked position matters commercially, capture it as a separate field — no amount of
nrecovers it later.
Precision without validity is a confident wrong number. Run the parsing audit first; it is the cheapest of the four and the most frequently skipped. Practical checks for the measurement layer are covered in how to track brand mentions in ChatGPT and other AI answers.
A reporting standard for AI visibility numbers
Never publish a bare mention rate. Adopt this format and the credibility problem disappears:
34% mention rate (95% CI 29–39%) · n_eff 280 · 200 prompts × 3 runs · ChatGPT · Jul 6–12
Six elements: point estimate, interval, effective sample, design, engine, window. It takes one line, survives cross-examination, and makes the honest answer to "did we improve?" — not detectably — a sayable sentence.
One free upgrade: AI share of voice costs nothing extra. Every competitor named in an answer you already paid for is a data point. Parse all brands from the same responses and you get a full competitive set at zero marginal cost, at the same effective sample size. The same pass also yields citation data — though mention rate and citation rate answer genuinely different questions and should never be averaged together.
Recommended designs by question
| What you need to answer | Prompts | Runs each | Cadence |
|---|---|---|---|
| Portfolio baseline, one engine | 150–200 | 3 | Weekly |
| Per-prompt diagnosis | 15–25 priority | 9–12 | Weekly |
| Detect a 10pp change | 200, frozen set | 3, paired | Weekly |
| Detect a 5pp change | 200, frozen set | 3, paired | Fortnightly pooled |
| Engine comparison | 150+ per engine | 3 | Monthly |
| Deep research / agentic modes | 20–30 frozen panel | 3 | Monthly |
| Competitive share of voice | Same answers | — | Free |
One structural note beyond engine ICC: prompt paraphrase variance is a separate cost centre from run variance. Three phrasings of one question behave closer to three prompts than three runs — they draw from different clusters — which makes phrasing diversity the cheaper way to buy effective sample. Search Engine Land's work on prompt-level visibility measurement covers the reporting side of that split.
Sizing on a smaller budget
Not every team can fund 600 answers per engine per week. Three tiers that stay honest:
| Budget per period | Design | What it supports | What it cannot do |
|---|---|---|---|
| ~150 answers | 50 prompts × 3 runs, 1 engine | Directional baseline, ±10pp | Any change detection, any segmentation |
| ~600 answers | 200 prompts × 3 runs, 1 engine | ±5pp level, paired 10pp detection | Multi-engine comparison, segment cells |
| ~1,800 answers | 200 × 3 across 3 engines | Per-engine ±5pp, engine gap analysis | Three-way segmentation |
The cut to make first is engines, not prompts. One engine measured at ±5pp beats three measured at ±12pp, because at ±12pp you cannot tell the three engines apart anyway. Pick the engine your buyers actually use, size it properly, and add engines as budget allows. This is also the right sequencing for smaller operations — founder-led brands and agencies reporting to clients both do better defending one precise number than six vague ones.
Frequently asked questions
What is AI visibility sample size?
AI visibility sample size is the number of prompts, repeat runs and engines required for a brand mention rate to carry a usable margin of error. It has two dimensions — prompt breadth and run depth — and they buy different kinds of certainty, so a single "number of prompts" answer is always incomplete.
Is 25 prompts enough to track brand mentions in ChatGPT?
Only for directional reads. At 25 prompts × 3 runs and ICC 0.57, effective sample is about 35 and margin of error near ±15pp — wide enough that a 30% rate and a 44% rate are statistically indistinguishable. It is a fine pilot; it cannot support a budget defence or a month-over-month claim.
Should I run prompts daily or run more prompts weekly?
More prompts, unless you are specifically chasing volatility. Daily runs of a small set stack observations inside the same clusters, so the design effect eats most of the gain. Daily cadence earns its keep for detecting engine drift and confirming when a published change reaches AI answers — not for tightening a level estimate.
Why does the same prompt give different brands each time?
Sampling temperature, retrieval index updates, personalisation, and platform-side experiments all contribute. In our 23,040-answer study only 34% of prompts returned an identical shortlist across 12 runs, and 41% flipped the tracked brand in or out at least once.
What confidence level should a marketing AI visibility report use?
95% for anything defending spend or claiming a win. 90% is acceptable for internal directional monitoring and narrows intervals by roughly 16% at the same sample size — just state which you used, because switching between them silently is how a flat quarter becomes a success story.
How many engines should I track?
Start with one, sized properly. Engine ICC ranges from 0.44 to 0.73 in our data, so a design that reaches ±5pp on Perplexity misses it on Gemini — funding six engines at a fixed budget means six imprecise numbers instead of one defensible one. Add engines only after the first is at ±5pp or better.
Does sample size differ for local or single-location brands?
Yes, and usually downward. Local queries return shorter shortlists with more stable membership, so observed rates sit closer to 0% or 100% where variance is lowest. The binding constraint becomes prompt validity — there may only be 40–60 queries anyone actually types about your category and city — so run that smaller set deeper, at 6–9 runs, rather than inventing prompts to hit 200.