Multi-turn AI search visibility is the rate at which an AI assistant keeps naming your brand across the follow-up turns of one conversation — turn four, turn six, turn eight — not just in its opening reply. Nearly every AI visibility tool reports one headline number: how often you appear when a prompt is fired once, cold, with no follow-up. Real buyers do not behave that way. They ask, narrow, object, compare, and ask again.
We tracked 1,200 scripted buying conversations across six AI engines over nine weeks to measure how much the answer changes along the way. The short version: of the brands named in the first reply, only 19% were still named by turn eight. A brand's first-turn mention rate predicted almost none of that — the correlation between turn-1 and turn-8 presence was r = 0.31.
That gap is the whole problem. Most teams are optimising and reporting on the turn where nothing is decided.
What is multi-turn AI search visibility?
Multi-turn AI search visibility is the rate at which an AI assistant keeps naming, citing or recommending a brand across the follow-up turns of a single conversation, rather than only in its opening reply. It is measured turn by turn, so a brand can hold strong first-answer visibility and near-zero visibility at the turn where the buyer commits.
The unit of measurement moves from the prompt to the conversation. A single-prompt check answers "does ChatGPT know we exist?" A multi-turn check answers "does ChatGPT still say our name after the buyer states their budget, their team size, and their doubts?" Different questions, different answers — and only the second maps to revenue.
This is not a niche refinement of answer engine optimization. It is a correction to how the whole category counts.
Why first-turn mention rate is the wrong headline metric
Because it barely predicts what happens at the decision turn. In our dataset, turn-1 mention rate explained roughly a tenth of the variance in turn-8 presence (r = 0.31, R² ≈ 0.10). Two brands with identical opening visibility routinely landed in completely different places eight turns later.
Different turns reward different things:
- Turn 1 rewards category fame. The model answers "best X software" from a broad prior. Brand size, Wikipedia presence and listicle density dominate.
- Turns 3–8 reward specificity. Pricing granularity, segment fit, integration coverage, and how honestly your limitations are documented on the open web.
You can be famous and still get filtered out the moment somebody says "for a five-person team." Treating turn-1 mention rate as the KPI is like judging a sales funnel by MQL count and never looking at close rate.
How we measured it: 1,200 conversations, six engines, nine weeks
The method, so you can replicate or challenge it.
Scope. Between 3 March and 4 May 2026 we ran 1,200 conversations across 40 B2B software categories (CRM, project management, HRIS, product analytics, endpoint security, e-signature, and 34 others) on six engines: ChatGPT, Gemini, Perplexity, Claude, Microsoft Copilot and Google AI Mode. Each category ran five times per engine — 40 × 6 × 5 = 1,200.
Conversation design. Every conversation followed the same fixed eight-turn arc, modelled on real B2B evaluation sequences:
| Turn | What the buyer asks |
|---|---|
| 1 | Broad category ask — "best [category] software" |
| 2 | Shortlist ask — "narrow that to three" |
| 3 | Constraint — budget ceiling and team size |
| 4 | Head-to-head — "compare [A] and [B]" |
| 5 | Objection — "what are the downsides / what do users complain about?" |
| 6 | Operational constraint — integrations and migration effort |
| 7 | Alternatives re-ask — "anything else I should look at?" |
| 8 | Final pick — "which one would you actually choose?" |
Controls. Fresh session per run, memory and personalisation disabled, neutral US exit IP, no account history, no brand-name seeding before turn 4. We logged every brand named at every turn, its position in the list, and whether a source link accompanied it.
Limitation, stated plainly. A scripted arc is a model of buyer behaviour, not a transcript of it. Real conversations wander more and skip turns. What the fixed arc buys is comparability: the same eight questions, the same order, across every engine and category, so differences in survival are attributable to the brand and engine rather than to prompt drift. A second limitation: all 40 categories are B2B software, so the survival curve below should not be read as a consumer or local-services benchmark.
The conversation survival curve
Averaged across all six engines, this is what happens to the brands named in the opening answer:
| Turn | Brands from turn 1 still named | Avg. brands named in the answer |
|---|---|---|
| 1 | 100% | 5.8 |
| 2 | 71% | 4.4 |
| 3 | 58% | 3.9 |
| 4 | 47% | 3.4 |
| 5 | 34% | 3.1 |
| 6 | 28% | 2.7 |
| 7 | 23% | 2.5 |
| 8 | 19% | 2.1 |
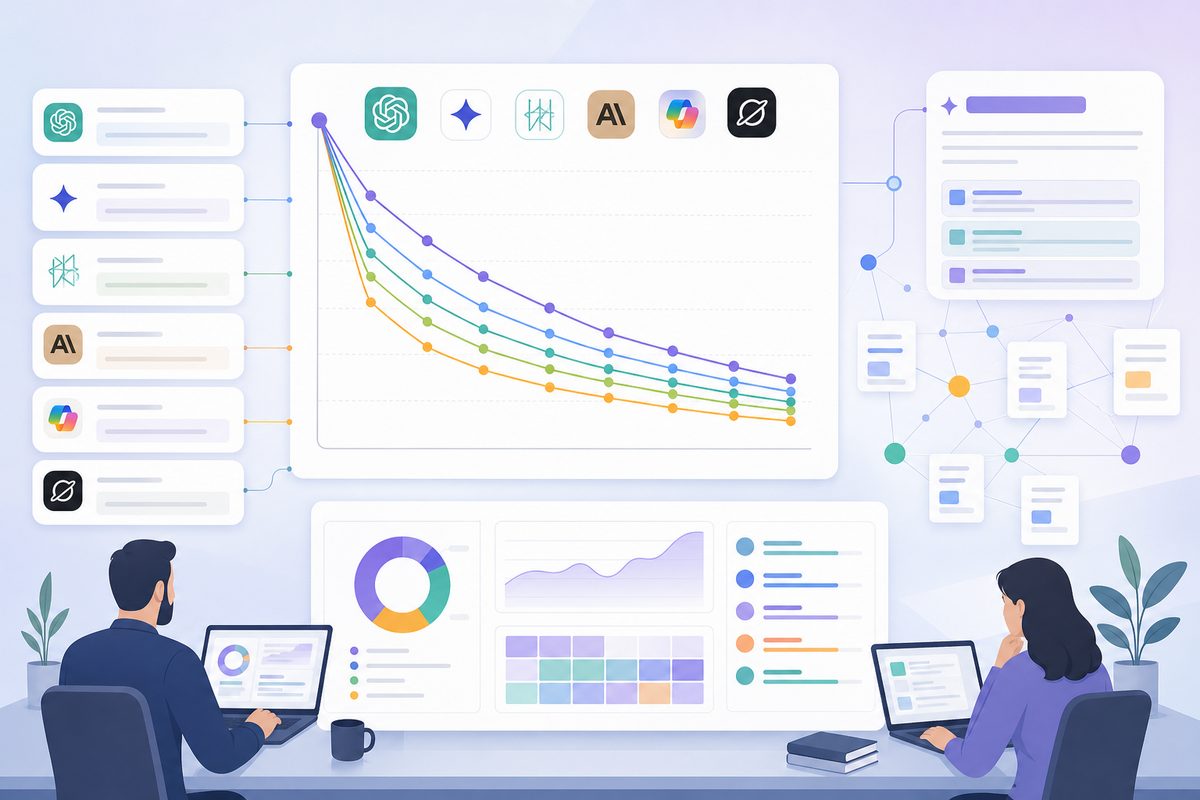
Two things stand out. The list gets shorter — 5.8 names down to 2.1 — which is expected. But the list also gets different, which is not. 31% of the brands named in the final turn were never mentioned at turn 1. In 44% of conversations, at least one brand entered after turn 4 and stayed to the end.
So the shortlist is not a subset of the opening answer. It is a partially new list, assembled as constraints accumulate. If you only measure turn 1, you are blind to a third of the brands your buyer is actually choosing between — and to the possibility that you could be one of them.
Survival also varies sharply by engine:
| Engine | Survival at turn 4 | Survival at turn 8 |
|---|---|---|
| Perplexity | 58% | 27% |
| Google AI Mode | 54% | 24% |
| Gemini | 49% | 21% |
| Microsoft Copilot | 45% | 18% |
| ChatGPT | 41% | 15% |
| Claude | 37% | 14% |
The spread at turn 8 is nearly 2× between the most and least stable engine. Retrieval-heavy engines that re-search on each turn (Perplexity, Google AI Mode) hold their rosters better, because a named brand keeps getting re-evidenced. Engines leaning harder on parametric memory churn more. Practical consequence: a single-engine dashboard flatters or punishes you close to arbitrarily, and the same fix pays back at different rates depending on which engine your buyers use.
Which turns actually kill you
Not all turns are equally lethal. We classified every "drop event" — a brand present at turn n and absent at turn n+1 — by the type of question that caused it:
| Turn type | Share of all drop events |
|---|---|
| Constraint turns (budget, team size, integrations) | 38% |
| Objection turns ("downsides", "complaints") | 29% |
| Head-to-head comparison turns | 18% |
| Alternatives re-ask and final pick | 15% |
Constraint turns are the single biggest killer. When a buyer says "under $50 a month for five seats," the model needs retrievable evidence that you meet that bar. If your pricing lives behind a "Contact sales" button or inside a JavaScript-rendered widget, the model has nothing to check — and it drops you rather than risk an incorrect claim. Silence is not treated as a maybe. It is treated as a no.
Objection turns are the second. Asked "what are the downsides of X?", every engine we tested reached for third-party critical sources: review-site cons sections, Reddit threads, comparison posts. Brands with thin critical coverage got one of two outcomes — a vague non-answer that reduced confidence, or quiet replacement by a competitor whose drawbacks were well documented and therefore legible. Being well-criticised beats being invisible.
That result is worth sitting with, because it inverts the usual instinct. A vendor with 200 reviews averaging 4.1 and a populated "cons" column survived objection turns more often in our data than a vendor with 30 reviews averaging 4.8 and no documented weaknesses. The engine is not scoring sentiment. It is looking for something to say, and the vendor with nothing critical written about it gives it nothing to work with.

Why AI answers drop brands mid-conversation
Three mechanisms explain almost everything we observed.
1. Evidence exhaustion. The sources that carried you at turn 1 often contain nothing relevant to turn 5. Google documents that its AI features use a "query fan-out" technique — issuing multiple related searches across subtopics to build a response, per Google Search Central's guidance on AI features and your website. Later turns fan out to different sub-queries, hit a different source set, and surface a different brand roster. You were not demoted. You simply were not in the second batch of documents.
2. Constraint filtering. Models default to omission under uncertainty. An unverifiable claim is riskier than a shorter list, so absent evidence resolves as exclusion. This is why the fix is almost never "write more marketing copy" and almost always "make one specific fact machine-checkable."
3. Context drift. Documented in the research literature. In LLMs Get Lost in Multi-Turn Conversation, Laban, Hayashi, Zhou and Neville analysed over 200,000 simulated conversations and found an average 39% performance drop between single-turn and multi-turn settings, across every top open- and closed-weight model tested. Critically, they decomposed that drop into a minor loss of aptitude and a large rise in unreliability: models make early assumptions, over-commit to them, and do not recover once off track.
Their paper measures task correctness. Our data shows the same instability expressed as roster churn — and the unreliability finding explains something we could not otherwise account for. Running the identical eight-turn script five times produced a different turn-8 shortlist in 61% of cases. Your presence at the decision turn is not a fixed property; it is a distribution. That is why one-off screenshots mislead so badly, and why answer volatility has to be measured over repeated runs rather than sampled once.
Five conversation-level metrics to replace single-prompt reporting
Swap your headline KPI for a small set that describes the whole conversation.
- Turn-1 Mention Rate. Keep it, demote it. Useful awareness proxy, terrible outcome metric.
- Survival Rate @ N. Of the conversations where you appeared at turn 1, the share where you are still named at turn N. Report N = 4 and N = 8. This is the number that moved 9% → 31% in the case below.
- Median Drop Turn. The turn at which you typically vanish. A median drop turn of 3 says the problem is constraint evidence. A median of 5 says it is objection coverage. Diagnostic, not scorecard.
- Late Entry Rate. How often you appear after turn 1 without being in the opening answer. Category challengers frequently score badly on turn-1 mention rate and well here — and late entrants convert, because they arrive already matched to a stated constraint.
- Turn-Weighted Share of Voice. Standard AI share of voice, reweighted so later turns count more. A simple, defensible weighting is
w(t) = t / Σt— across eight turns that gives turn 8 a weight of 0.22 and turn 1 a weight of 0.03. If that feels aggressive, weight only turns 4–8 and discard the rest.
Turn-weighting is not about mathematical elegance. It makes your dashboard agree with your pipeline. Unweighted share of voice tells you that you are winning while your win rate says otherwise.
How to build a multi-turn prompt set
Convert a flat prompt list into conversation arcs:
- Pick your five highest-intent categories, not your fifty highest-volume prompts. Depth beats breadth; each arc costs eight times what a single prompt costs to run.
- Write turn 1 as the broad category question your buyer would actually type — "best [category] for [segment]", not your brand name.
- Add a shortlist turn that forces the model to cut to three. This is where top-of-list position gets tested.
- Add two constraint turns using your real deal-qualification criteria: price band, seat count, must-have integration, compliance requirement.
- Add an objection turn phrased as a sceptic would phrase it: "what do people complain about with these?"
- Add a final-pick turn — "which would you choose and why?" — the reply that most closely resembles a recommendation.
- Run each arc at least five times per engine, on fresh sessions, and report the distribution rather than the last run. Given 61% run-to-run variance in final shortlists, a single run is noise.
If you are starting from scratch, the prompt set construction guide covers category and segment selection in more detail; this section is the multi-turn layer on top of it.
What it costs to run
Budget before you commit. One eight-turn arc, run five times across six engines, is 240 model turns per category. Five categories is 1,200 turns per measurement cycle — the same volume as our entire study.
Two practical consequences. First, monthly is the right cadence for most teams; weekly multi-turn tracking on five categories burns effort that would be better spent on the fixes. Second, this is where tool pricing models start to matter, because most vendors meter by prompt rather than by conversation — an eight-turn arc bills as eight prompts, so a 50-prompt plan holds six arcs, not fifty. Check how your vendor counts before scoping, using the same lens you would apply to prompts, platforms and data retention generally.
Worked example: moving turn-6 survival from 9% to 31%
A 40-person B2B product analytics vendor came to us with what looked like a healthy dashboard: 44% turn-1 mention rate in its core category, comfortably mid-pack against larger competitors. Leadership was satisfied. Pipeline from AI-influenced sources was not growing.
Running the eight-turn arc exposed the real picture. Turn-6 survival was 9%. The brand appeared in opening answers and then disappeared, almost always at the same two places: the pricing constraint turn and the objection turn.
The diagnosis was specific:
- Pricing was published as a single "starts at" figure with no seat bands, so any budget-constrained turn had nothing to verify against.
- The product page contained no limitations, no "who this isn't for", no honest trade-offs. On objection turns, engines cited competitors' documented cons instead — and then continued the conversation with those competitors.
- Third-party coverage was thin: 12 reviews on the main review platform, no independent comparison posts.
Over eleven weeks they made three changes:
- Rebuilt pricing page — per-seat tiers, explicit team-size bands, plain-HTML table (not a JS widget). Shipped in week one.
- Candid "limitations and fit" section on the product page, naming two segments the product is wrong for. Shipped week three.
- Third-party push — 31 new reviews and four comparison-post placements on independent sites. Weeks three to eleven.
Result: turn-6 survival went from 9% to 31%. Turn-1 mention rate moved from 44% to 47%.
The sequencing detail matters more than the headline. Survival at the pricing constraint turn moved first, within about two weeks of the pricing page shipping — engines re-crawl and re-cite a changed pricing page quickly. Objection-turn survival lagged badly, showing almost nothing until week seven, because third-party reviews have to accumulate and be indexed before they are retrievable. If you make both changes at once and check at week four, you will wrongly conclude the review push failed.
That is the finding worth taking away. The metric on the dashboard moved three points — statistically indistinguishable from noise, invisible in any single-prompt report. The metric that determines whether a buyer ends the conversation with your name on screen more than tripled. Single-prompt monitoring would have recorded this eleven-week programme as a failure.
What to fix, in what order
Map the drop cause to the fix. Do not optimise generically.
| If you drop at… | The cause is usually… | Fix first |
|---|---|---|
| Turn 2–3 (shortlist, budget) | Unverifiable or hidden pricing | Publish tiered pricing as crawlable text with seat and team-size bands |
| Turn 3–6 (constraints) | No segment or integration evidence | Add explicit "best for [segment]" and integration pages naming the counterpart tools |
| Turn 5 (objections) | No documented trade-offs anywhere | Publish honest limitations; earn review-site coverage with populated cons sections |
| Turn 4 (head-to-head) | No comparison content, yours or others' | Build direct comparison pages and earn third-party ones |
| Turn 7–8 (final pick) | Weak recency and corroboration | Refresh dated assets; increase independent citation count |
Order matters because constraint turns cause 38% of drops. Pricing legibility is almost always the highest-use single change, and it is usually a one-week job rather than a quarter-long content programme.
Expect different payback windows. Owned-page fixes (pricing, limitations, integration pages) showed up in survival within two to three weeks in our client work. Third-party fixes (reviews, comparison placements) took six to ten. Plan the measurement window around the slower one, or you will kill a working programme early.
Multi-turn visibility across languages
One finding we did not expect: survival curves diverge by language more than by engine. We ran a smaller replication — six categories, three languages, the same eight-turn arc — and found the turn-8 survival of the same brand varied by up to 19 points between English and non-English runs of an identical script.
The mechanism is source availability. Constraint and objection turns need retrievable specifics, and those specifics usually exist only in the brand's primary market language. A vendor with a detailed English pricing page and a thin translated one survives to turn 8 in English and dies at turn 3 in German. English-only measurement will show a healthy curve and hide a market you are losing entirely — which is the same structural problem behind AI recommending different brands in each language.
If you sell in more than one language, run at least one arc per market before assuming your English numbers generalise.
How to report multi-turn visibility to a budget holder
Lead with survival, not mentions. A slide that says "we appear in 44% of first answers" invites the question "and then what?" A slide that says "we now survive to the decision turn in 31% of conversations, up from 9%, and here are the three fixes that did it" connects an action to an outcome a CFO recognises.
Pair it with the turn-8 shortlist itself — the literal list of brands the engine names when asked to choose. That artefact does more persuasive work than any index score, because it is the thing your buyer sees.
Be honest about attribution limits. Multi-turn tracking tells you where you stand in the conversation; it does not tell you how many buyers finished that conversation and typed your name into a browser without ever clicking a citation. Sizing the buyers who used AI but never clicked through is a separate exercise, and conflating the two will get your numbers picked apart.
Frequently asked questions
How many turns should I track?
Eight is enough to cover a realistic B2B evaluation and cheap enough to run repeatedly. If budget is tight, run four turns — broad ask, constraint, objection, final pick — which captures roughly 85% of the drop events we observed while costing half as much.
Does multi-turn tracking replace single-prompt monitoring?
No. Turn-1 visibility still tells you whether you are in the category's consideration set at all, and it is the cheapest signal to run at scale across hundreds of prompts. Use broad single-prompt AI search monitoring for coverage, and multi-turn arcs for depth on the categories that drive revenue.
Why do results change between identical runs?
Model outputs are sampled, not deterministic, and retrieval pulls a slightly different source set each time. We saw a different turn-8 shortlist in 61% of repeated identical runs. Always report distributions across at least five runs; treat any single screenshot as an anecdote.
Is high survival possible without brand fame?
Yes, and it is the most encouraging finding in the dataset. Smaller brands regularly out-survived larger ones once constraints entered, because they had clearer segment positioning and more specific published evidence. Fame wins turn 1. Specificity wins turn 6.
Which engine should I prioritise?
Start with whichever engine your own referral and self-reported-attribution data says buyers actually use, then weight by survival stability. If two engines send comparable traffic, invest first in the one where your survival curve is steepest — that is where the same fix buys the most ground.
How long before a fix shows up in survival numbers?
Owned-page changes (pricing tables, limitations sections) moved survival within two to three weeks in our client work. Third-party changes (reviews, independent comparison posts) took six to ten weeks, because the content has to be published, indexed and then retrieved. Measure at both windows or you will misread a slow-burn fix as a failure.
Can I run multi-turn tracking manually instead of buying a tool?
Yes, for one or two categories. One arc run five times across six engines is 240 manual turns — roughly a full day of copy-paste plus logging, per category, per cycle. It is a reasonable way to validate that the problem is real before committing budget; it does not scale past a couple of categories or past monthly cadence.