AI visibility tools are accurate enough for directional trend monitoring when they preserve raw responses, disclose failed runs, validate brand matching, and expose score formulas. They are not a census of every buyer’s AI experience. Treat each metric as a sample estimate tied to a defined prompt, engine, location, account state, and time window.
The important question is not whether one platform reports 41% visibility and another reports 46%. It is whether either number accurately represents the answers collected—and whether that sample reflects the AI experiences relevant to your buyers.
The buyer’s verdict:
- Use AI visibility tools to track controlled trends, brand mentions, citations, and competitor inclusion.
- Do not treat their scores as market-wide exposure, audience reach, or revenue attribution.
- Require raw answers for every successful observation.
- Keep failed runs visible and separate from valid brand omissions.
- Test entity matching against manually labeled answers.
- Repeat prompts to measure normal answer variation.
- Recalculate at least one headline metric before signing an annual contract.
How accurate are AI visibility tools for different decisions?
Accuracy depends on the decision. A platform may be suitable for content research but not reliable enough for an executive KPI.
| Decision | Is an AI visibility tool suitable? | Required condition |
|---|---|---|
| Track visibility trends | Usually | A fixed prompt-engine panel, repeated sampling, and versioned methodology |
| Discover citations and source opportunities | Usually | Raw links, URL normalization, and deduplication |
| Compare brands within a tracked prompt set | Yes, with limits | Identical prompts, engines, locations, timing, and counting rules |
| Report an AI share of voice | Directionally | The denominator and competitor set are disclosed |
| Rank brands across narrative answers | Use caution | Recommendation tiers are used when no explicit order exists |
| Estimate what every AI user sees | No | Tools observe samples, not the full population of personalized answers |
| Attribute pipeline or revenue to AI visibility | Not by itself | Separate referral, conversion, CRM, and controlled-experiment data are required |
A score can be calculated perfectly and still answer the wrong business question. That is why buyers must test both measurement integrity and sample representativeness.
What does “accuracy” mean in AI search monitoring?
AI visibility accuracy is the degree to which captured answers, extracted labels, and calculated metrics match a documented measurement target. It has three distinct parts:
- Observation fidelity: Did the platform capture the answer actually returned under the stated conditions?
- Classification accuracy: Did it correctly identify brands, recommendations, sentiment, positions, and citations?
- Sample validity: Do the selected prompts, engines, markets, and collection times represent the buyer journey being measured?
These questions must be evaluated separately. High entity-matching precision cannot rescue an irrelevant prompt set. A representative prompt set cannot rescue missing transcripts or incorrect calculations.
| Accuracy layer | What must be correct | Typical hidden error |
|---|---|---|
| Surface fidelity | Interface or API, model, mode, account state, locale, and search setting | An API response is presented as equivalent to the consumer product |
| Capture completeness | Every scheduled run has a successful or failed status | Timeouts disappear from the denominator |
| Entity matching | Brand, product, alias, acronym, and domain rules | A common noun is counted as the brand |
| Recommendation interpretation | Ordered and narrative recommendations follow declared rules | The first brand string is automatically assigned rank one |
| Citation counting | URLs, domains, redirects, fragments, and duplicates are normalized | One source is counted several times |
| Metric calculation | Exported observations reproduce dashboard scores | Weights or exclusions remain hidden |
| Sample validity | Prompts and surfaces correspond to actual buyer journeys | Direct-brand prompts inflate category visibility |
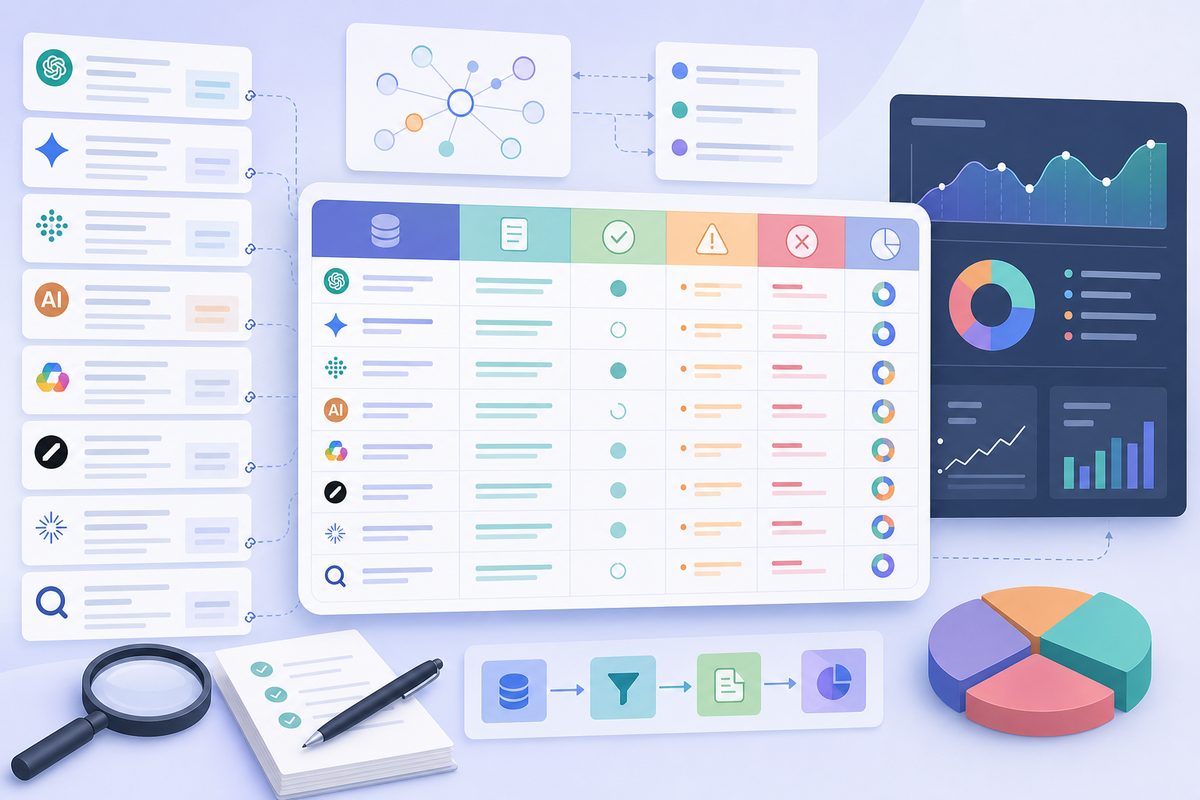
Two tools can disagree without either having a software defect. They may monitor different product surfaces, run at different times, use different locales, or define a citation differently. The disagreement becomes a data-quality problem when those choices are hidden.
Why does the same prompt produce different measurements?
Generative systems can return different valid answers because they select among multiple plausible outputs and may retrieve changing web evidence. Model version, sampling settings, search availability, location, account state, conversation context, and collection time can all alter the brands and sources returned.
OpenAI’s official reproducible-output guidance describes seeded output as “mostly deterministic,” not guaranteed. Google likewise documents temperature as a control that affects randomness in its Vertex AI content-generation parameters.
Other sources of variation include:
- Retrieval changes: Search indexes, available pages, and cited evidence change.
- Model routing: A consumer product may route requests between models or modes.
- Personalization: Location, account history, subscriptions, and prior conversation can affect an answer.
- Surface differences: An API may use different instructions, retrieval tools, citation logic, and safety policies from a consumer interface.
- Prompt interpretation: Small formatting or context differences can change the inferred task.
- Temporal events: News, product launches, outages, and reputation events can change recommendations.
A single answer is therefore an observation, not a permanent ranking. Running the same prompt once is useful for discovery, but too narrow for a budget or performance conclusion.
Consistent answers are not automatically evidence of a better tool. They could reflect stable model behavior, but they could also indicate cached responses, suppressed variation, or repeated display of an earlier capture. Buyers should inspect timestamps and raw answers before interpreting stability.
What AI visibility tools cannot measure accurately
Even a technically strong platform cannot make certain claims from prompt monitoring alone.
Market-wide AI reach
There is no complete public denominator showing how often every buyer submits each prompt across ChatGPT, Gemini, Perplexity, AI Overviews, Copilot, and other systems. A dashboard’s “visibility” usually means visibility within its tracked prompt set, not percentage of all AI users reached.
Every personalized answer
A monitoring account cannot reproduce every user’s location, history, subscription, language, device, conversation context, and product experiment. It can sample defined conditions.
True prompt demand
Traditional keyword volume should not be treated as equivalent to AI prompt volume. Search keywords can help prioritize topics, but conversational prompts are longer, frequently reformulated, and often unavailable through public volume datasets.
Causal revenue impact
A visibility increase followed by more pipeline is correlation, not proof that AI exposure caused the increase. Revenue attribution requires referral data, CRM evidence, surveys, experiments, or another causal design.
Cross-platform comparability without a common specification
A 50% score from one vendor is not directly comparable with 50% from another unless prompts, repetitions, engines, locations, failure handling, entity rules, and formulas match.
The two-gate accuracy model
maxaeo’s buyer framework uses two gates. A platform must pass both before its data should influence budget or executive reporting.
Gate 1: Is the measurement scope valid?
Define the measurement target before viewing a dashboard.
| Scope decision | What to document |
|---|---|
| Business question | Category discovery, competitor comparison, reputation, citations, or another defined use case |
| Buyer segments | Company size, industry, role, knowledge level, and purchase stage |
| Prompt portfolio | Exact prompts grouped by commercial behavior |
| AI surfaces | Consumer interface, API, AI search experience, model, and mode |
| Markets | Country, language, and any location setting |
| Account context | Logged in or out, subscription tier, personalization state |
| Conversation state | Clean conversation or intentionally preserved context |
| Collection window | Dates, times, repetition schedule, and time zone |
| Weighting | Equal weights or documented business-value weights |
| Competitor set | Which brands count in share-of-voice calculations |
Do not mix direct-brand prompts with category-discovery prompts without separating the results. “Is maxaeo good?” naturally produces more brand mentions than “What are the best AI visibility platforms?” Combining them can inflate visibility without any change in category discovery.
Prompt weights should reflect documented commercial importance, not be adjusted after results are known. If reliable demand data is unavailable, report unweighted results alongside any weighted score.
Gate 2: Does the platform pass TRACE?
TRACE is a 100-point, vendor-neutral audit for Transcript evidence, Repeatability, Availability accounting, Classification quality, and Equation reproducibility.
| TRACE component | Weight | Full-credit requirement |
|---|---|---|
| T — Transcript evidence | 25 | Raw answer, exact prompt, engine, timestamp, citations, and run configuration are retained |
| R — Repeatability | 15 | Repeated runs are supported and variation is reported |
| A — Availability accounting | 20 | Every scheduled run has a status; failures remain in coverage reporting |
| C — Classification quality | 20 | Mention, alias, recommendation, sentiment, and citation rules survive human review |
| E — Equation reproducibility | 20 | Exported observations rebuild headline metrics within the stated rounding tolerance |
TRACE measures whether a result is defensible. It does not make two different sampling frames equivalent, and it cannot compensate for prompts that fail Gate 1.
The AI visibility data-quality checklist provides additional row-level checks to apply before trusting a dashboard.
How to run a 120-answer pre-purchase audit
Schedule 120 answers using five commercial prompts, four priority engines, three repetitions, and two collection days. This is a practical acceptance test designed to expose obvious capture, classification, failure-handling, and repeatability problems. It is not a universal statistical benchmark.
5 prompts × 4 engines × 3 repetitions × 2 days = 120 scheduled answers
Choose prompts representing five buyer behaviors:
- Category shortlist: “What are the best platforms for [category]?”
- Use-case recommendation: “What should a [company type] use for [job]?”
- Competitor alternative: “What are alternatives to [competitor]?”
- Direct comparison: “Compare [brand] with [competitor].”
- Risk or reputation check: “What are the main drawbacks of [brand]?”
Use the four surfaces most important to your audience. If only two materially affect the buying journey, run more prompts or collection days instead of adding irrelevant engines.
Submit identical prompts to every vendor within the shortest practical window. Keep repetitions separate and use clean conversations unless conversational tracking is the explicit measurement target.
1. Freeze a measurement contract
Before collecting data, document:
- Exact prompt text and prompt IDs.
- Engine, product surface, model label, and search mode.
- Country, language, time zone, and account state.
- Whether each run begins in a clean conversation.
- Brand aliases and product-to-parent relationships.
- Competitors included in share of voice.
- Definitions of mention, recommendation, rank, sentiment, and citation.
- Failure categories and denominator rules.
- Prompt and engine weights.
- Rounding policy.
This contract prevents methodology from shifting after someone sees an inconvenient result.
2. Require an observation-level export
Each scheduled run should have a row containing at least:
| Field | Why it matters |
|---|---|
| Run ID | Connects the schedule, raw answer, and dashboard record |
| Prompt ID and exact prompt | Detects text changes and prompt substitutions |
| Scheduled and attempted time | Exposes delays and missing runs |
| Engine and surface | Distinguishes APIs from consumer experiences |
| Model or displayed mode | Records the monitored configuration |
| Locale and account state | Documents geographic and personalization conditions |
| Run status | Separates valid answers from failures |
| Full raw answer | Supplies the evidence behind extracted labels |
| Raw cited URLs | Enables citation reconciliation |
| Extracted labels | Allows comparison with human review |
| Parser and rule-set version | Explains historical reclassification |
| Formula version | Makes dashboard changes traceable |
A platform that stores only “mentioned: yes,” “rank: 3,” or “sentiment: positive” cannot support a serious accuracy claim. Those fields are interpretations; the answer is the evidence.
3. Audit raw-answer capture
Review every failed run and a stratified sample of at least 20 successful captures. Include each engine, prompt type, and collection day.
Check that:
- The exported answer matches the preserved response.
- Text has not been truncated before a relevant mention.
- Citations remain associated with the correct passage.
- Links shown in the answer also appear in the export.
- The engine and mode labels describe the actual surface.
- Timestamps include a time zone.
- Conversation context is empty when a clean run was specified.
- Screenshots or immutable text snapshots are available for disputes.
- Historical evidence does not change silently after a parser update.
If no preserved source view exists, the vendor cannot prove whether an error occurred during generation, capture, parsing, or display.
4. Account for every failed response
A refusal, timeout, authentication problem, retrieval failure, and parser error are not equivalent to a valid answer that omits the brand.
Assign every scheduled run one status:
- Successful answer with the brand.
- Successful answer without the brand.
- Valid refusal.
- Timeout.
- Authentication or access failure.
- Retrieval or tool failure.
- Capture failure.
- Parser failure after the raw answer was stored.
Report both:
Successful-answer visibility = valid answers mentioning the brand ÷ successful answers
Scheduled-run visibility = valid answers mentioning the brand ÷ all scheduled runs
The first describes the valid answers observed. The second exposes operational coverage. Neither should replace the other.
Also calculate:
Capture success = successful answers ÷ scheduled runs
A high successful-answer visibility rate can coexist with poor coverage. If failures cluster around one engine, geography, or prompt type, the remaining answers may not be representative.
5. Test brand matching with a human-labeled set
Entity matching should be evaluated with precision and recall, not anecdotal spot checks. Manually label the target brand and tracked competitors across all 120 answers when possible.
Calculate:
Precision = true positives ÷ (true positives + false positives)Recall = true positives ÷ (true positives + false negatives)F1 = 2 × precision × recall ÷ (precision + recall)
Include difficult cases:
- A brand name that is also a common noun.
- An acronym shared with another organization.
- A product mentioned without its parent company.
- A domain cited without the brand appearing in prose.
- Possessive, plural, misspelled, or hyphenated variants.
- A brand named in negative or exclusionary language.
- A brand appearing only in a source title.
- A comparison that mentions the brand but recommends a competitor.
Keep these labels separate:
- Brand mentioned in answer text.
- Brand recommended.
- Brand mentioned with caveats.
- Brand explicitly not recommended.
- Brand domain cited as a source.
Combining them makes brand visibility look higher while hiding whether the brand was actually endorsed.
6. Measure repeatability as variation
Repeatability measures how much results change under nominally identical conditions. It should not force variable AI answers into a fictional fixed ranking.
For each prompt-engine-day cell, compare the three repetitions:
- Presence agreement: Did all runs agree that the target brand appeared?
- Brand-set overlap: Use pairwise Jaccard similarity:
brands in both answers ÷ brands in either answer. - Citation overlap: Apply the same calculation to normalized URLs or domains.
- Position agreement: Compare rank only when the response contains a defensible order.
- Sentiment agreement: Compare both the label and its supporting passage.
Suppose three answers recommend {A, B, C}, {A, B, D}, and {A, C, D}. Brand A has perfect presence agreement, but each pair has a brand-set Jaccard score of 2 ÷ 4 = 0.50. Reporting only A’s stable presence would conceal substantial shortlist volatility.
Do not rely on one pooled repeatability percentage. Report variation by prompt and engine because one unstable surface can disappear inside a portfolio average.
7. Audit recommendation position and citations separately
Recommendation rank is defensible only when the answer provides an order or the vendor applies a consistent, reviewable interpretation rule.
| Answer structure | Defensible measurement |
|---|---|
| Explicit numbered list | Ordinal rank, with declared rules for ties and exclusions |
| Comparison table | Row or column position plus any explicit recommendation |
| Narrative recommendations by use case | Mention order and recommendation tier |
| General discussion without endorsement | Mention only; no recommendation rank |
| Negative or exclusionary statement | Mention with negative disposition; not a positive rank |
For narrative answers, use labels such as recommended, recommended for a specific use case, mentioned, considered with caveats, and not recommended. Assigning rank one to the first brand string can turn a disclaimer, source title, or negative example into a false win.
Citation accuracy requires a separate audit. A citation placement, linked URL, canonical page, and unique domain answer different questions.
Normalize citations by:
- Lowercasing hostnames.
- Removing navigation fragments.
- Removing known tracking parameters.
- Resolving redirects when policy permits.
- Preserving meaningful path and query parameters.
- Mapping mobile or syndicated variants only when equivalence is documented.
- Deduplicating repeated references according to the declared unit.
Report:
- Citation placements: All reference appearances.
- Unique cited URLs: Distinct canonical pages.
- Unique cited domains: Distinct source domains.
A cited company domain does not prove the company was recommended. The guide to AI search citation tracking explains how mentions, linked sources, and unique citations should be separated.
8. Recalculate the headline score
A metric is auditable only when its numerator, denominator, weights, exclusions, and rounding rules are documented.
For basic visibility:
Brand visibility = successful answers mentioning the brand ÷ successful answers
For share of voice within a declared competitor set:
AI share of voice = target-brand mentions ÷ all tracked-brand mentions
For weighted prompts:
Weighted visibility = Σ(prompt weight × mention indicator) ÷ Σ(weights for eligible observations)
“Eligible observations” must be defined. Otherwise refusals, unsupported engines, parser failures, or low-confidence classifications can disappear silently.
Clarify whether:
- Each brand counts once per answer or once per occurrence.
- Direct-brand prompts are included.
- Failed runs remain visible in coverage reporting.
- Prompts and engines receive equal weights.
- Negative mentions count toward visibility.
- Citation-only appearances count as brand mentions.
- Scores are recalculated retroactively after rule changes.
Export one reporting period and rebuild the dashboard metric independently. The result should match within the documented rounding tolerance. See how to calculate an AI visibility score for formula and denominator examples.
Worked example: how a correct-looking score becomes misleading
This synthetic reconciliation shows how failures, false matches, and citation duplication can change a plausible dashboard result. It is not a vendor benchmark or claimed field study.
A test schedules 120 answers. Eighteen runs fail, leaving 102 successful responses. The platform labels 46 successful answers as target-brand mentions and reports 45.1% visibility.
Manual review finds:
- 38 true-positive mentions.
- 8 false-positive mentions.
- 5 missed true mentions.
- 43 corrected mentions in total.
- 71 displayed citation placements.
- 49 placements after duplicate-reference normalization.
- 31 unique cited domains.
| Measure | Dashboard result | Recalculated result | Finding |
|---|---|---|---|
| Capture success | Not shown | 85.0% | 102 of 120 runs succeeded |
| Mention precision | Not shown | 82.6% | 38 of 46 detected mentions were correct |
| Mention recall | Not shown | 88.4% | 38 of 43 actual mentions were detected |
| Mention F1 | Not shown | 85.4% | Combined classification measure |
| Successful-answer visibility | 45.1% | 42.2% | Corrected from 46 to 43 mentions |
| Scheduled-run visibility | Not shown | 35.8% | Includes all 120 scheduled runs |
| Citation placements | 71 | 49 normalized | Duplicate reduction of 31.0% |
| Unique cited domains | Not shown | 31 | A different unit from placements |
The displayed 45.1% is mathematically correct for the platform’s labels and successful-only denominator: 46 ÷ 102. It is not classification-correct because eight detections are false and five real mentions are missing.
The corrected successful-answer rate is 43 ÷ 102 = 42.2%. The scheduled-run rate is 43 ÷ 120 = 35.8%. These figures answer different questions and should both be visible.

What accuracy thresholds should buyers require?
There is no accepted industry-wide accuracy standard for AI visibility platforms. The following are proposed acceptance thresholds, not universal benchmarks.
| Check | Decision-grade target | Investigate | Stop condition |
|---|---|---|---|
| Raw-answer availability | 100% of successful runs | Any unexplained gap | Raw evidence unavailable |
| Capture success | At least 95% | 90%–94.9% | Below 90% or failures hidden |
| Entity precision | At least 95% | 90%–94.9% | Below 90% |
| Entity recall | At least 90% | 80%–89.9% | Below 80% |
| Metric reconciliation | Within 0.1 percentage point | Difference up to 1 point | More than 1 point unexplained |
| Failed-run accounting | All scheduled runs classified | Incomplete categories | Failed runs deleted |
| Method versioning | Parser, rules, and formulas versioned | Partial history | Historical data changes silently |
These thresholds should be tightened when false claims, missed reputation issues, or executive compensation depend on the data.
Repeatability needs a different rule. Low agreement may reflect genuine answer-engine variation rather than platform error. Require the vendor to report the variation and preserve each observation; do not demand identical answers.
What TRACE score is good enough?
| TRACE score | Appropriate use |
|---|---|
| 85–100 | Decision-grade monitoring with periodic manual audit |
| 70–84 | Directional trend tracking; investigate material changes |
| 50–69 | Research, prompt discovery, and hypothesis generation |
| Below 50 | Do not use for performance reporting |
These are maxaeo’s proposed buyer thresholds, not published industry benchmarks.
Regardless of the total score, stop the procurement process if:
- Raw answers cannot be inspected.
- Failed runs are deleted or impossible to export.
- The monitored engine surface cannot be identified.
- Mention rules cannot be tested with edge cases.
- A headline metric cannot be reconstructed.
- Historical answers can change without a version record.
- The vendor claims market-wide reach without a defensible population denominator.
A high TRACE score also cannot rescue an unrepresentative prompt portfolio. Gate 1 and Gate 2 must both pass.
Which features actually improve accuracy?
Commercial comparisons often emphasize the number of dashboards, integrations, and tracked prompts. Accuracy depends more directly on evidence and controls.
| Feature | Why it matters |
|---|---|
| Full transcripts and source snapshots | Enables capture and classification audits |
| Configurable aliases with backtesting | Corrects entity errors without obscuring historical impact |
| Repeated sampling | Separates stable visibility from answer variation |
| Failed-run logs | Exposes coverage gaps and denominator bias |
| Surface and configuration metadata | Shows what experience was actually measured |
| Versioned parsers and formulas | Prevents unexplained historical changes |
| Row-level exports or API access | Allows independent reconciliation |
| Citation normalization controls | Prevents duplicate sources from inflating results |
| Fixed-panel reporting | Measures change without prompt-composition drift |
Features such as automated reports, alerts, competitor suggestions, and integrations can save time, but they do not prove data quality. Use a feature comparison, such as maxaeo’s review of AI visibility tracking tools, to build a shortlist—then run the same acceptance audit on every finalist.
What should vendors disclose before purchase?
A credible vendor should answer data-quality questions with exports and examples, not assurances.
Ask:
- Which interfaces, APIs, models, modes, locales, and account states are monitored?
- What substitute is used when direct access to a surface is unavailable?
- Can every chart point be opened as a raw answer?
- How long are transcripts and screenshots retained?
- Are prompts repeated, and how is variation reported?
- What percentage of scheduled runs failed in the last complete period?
- How are refusals, timeouts, retrieval errors, and parser failures separated?
- Can customers edit aliases and backtest rule changes?
- How are narrative recommendations classified?
- What is the counting unit for citations?
- Are parser, normalization, and formula changes versioned?
- Can all observation-level data be exported?
- Can the vendor rebuild one displayed metric from that export during the pilot?
- What happens to historical charts when prompts or engines are added?
- Can customers retrieve their data after cancellation?
“Proprietary methodology” is not a sufficient reason to hide denominators. A vendor can protect its implementation while still documenting what a metric means.
How should accuracy be monitored after deployment?
Accuracy must be rechecked because models, interfaces, retrieval systems, aliases, and parsers change. Passing a pilot does not make the data permanently reliable.
Maintain a monthly quality panel of 30–50 stable prompts. Preserve the prompt text, engine configuration, aliases, weights, and known edge cases.
Each month:
- Review a stratified sample of raw answers.
- Recalculate entity precision and recall.
- Compare scheduled, attempted, and successful run counts.
- Inspect failure rates by engine and prompt type.
- Reconcile one visibility metric and one citation metric.
- Review model, parser, formula, and normalization versions.
- Re-run ambiguous-brand test cases.
- Annotate methodology changes on trend charts.
- Investigate visibility changes that coincide with capture or classification changes.
Use a same-panel trend for executive reporting. If prompts must change, run the old and new panels in parallel for at least one reporting cycle. Report the old-panel trend separately and establish a new baseline instead of splicing incompatible scores together.
A weekly AI visibility dashboard should display coverage, variation, and methodology changes alongside the headline visibility score. This helps teams distinguish market movement from measurement movement.
Frequently asked questions
How accurate are AI visibility tools?
Strong AI visibility tools can accurately capture and classify the answers they sample, but they cannot guarantee that those samples match every user’s personalized experience. Accuracy should be demonstrated through raw transcripts, repeated prompts, failure accounting, human-tested brand matching, citation normalization, and reproducible formulas.
Can two AI visibility platforms disagree and both be accurate?
Yes. Both can produce valid estimates if they monitor different interfaces, model versions, locations, account states, times, or prompt repetitions. Their scores are not comparable until the measurement specifications and formulas are aligned. If both claim identical conditions but their classifications conflict, inspect the raw answers.
Is monitoring an API equivalent to monitoring the consumer interface?
No. APIs and consumer products may use different system instructions, model routing, retrieval tools, personalization, citation behavior, and safety logic. API monitoring can still be useful, but it must be labeled accurately and should not be presented as a direct replica of a consumer experience without evidence.
How many answers should a pre-purchase audit include?
A practical starting point is 120 scheduled answers: five commercial prompts across four priority engines, repeated three times on two days. This is an acceptance test, not a universal sample-size standard. High-stakes reputation monitoring, multiple languages, or regional campaigns require a larger and more diverse sample.
What accuracy thresholds should a buyer require?
A reasonable starting requirement is 100% raw-answer availability for successful runs, at least 95% capture success, 95% entity precision, 90% recall, complete failed-run accounting, and metric reconciliation within 0.1 percentage point after rounding. These are proposed procurement thresholds, not industry benchmarks.
Can a tool show exactly what every buyer sees?
No. AI answers can vary by account, location, language, conversation, product mode, model routing, retrieval state, and time. A tool can measure a documented set of conditions and report variation across repeated samples. It cannot observe every personalized answer.
How often should AI visibility accuracy be audited?
Run a full acceptance audit before purchase, then perform monthly quality checks on a stable prompt panel. Re-audit immediately after major engine, parser, alias, formula, or prompt-set changes.
The decision rule before trusting a dashboard
Do not buy an AI visibility platform because its score looks precise. Buy it only if the sample matches your buyer journey and the evidence lets you challenge every number.
Before signing:
- Freeze the measurement scope.
- Run the 120-answer acceptance test.
- Score the platform with TRACE.
- Inspect every failure and a stratified set of raw answers.
- Validate entity matching against human labels.
- Normalize citations and review narrative recommendations.
- Rebuild one headline metric independently.
- Establish a fixed post-purchase quality panel.
The best AI visibility tool is not the one that claims perfect accuracy. It is the one that makes its sampling limits, failed runs, classifications, and formulas visible—and still produces a result your team can reproduce.