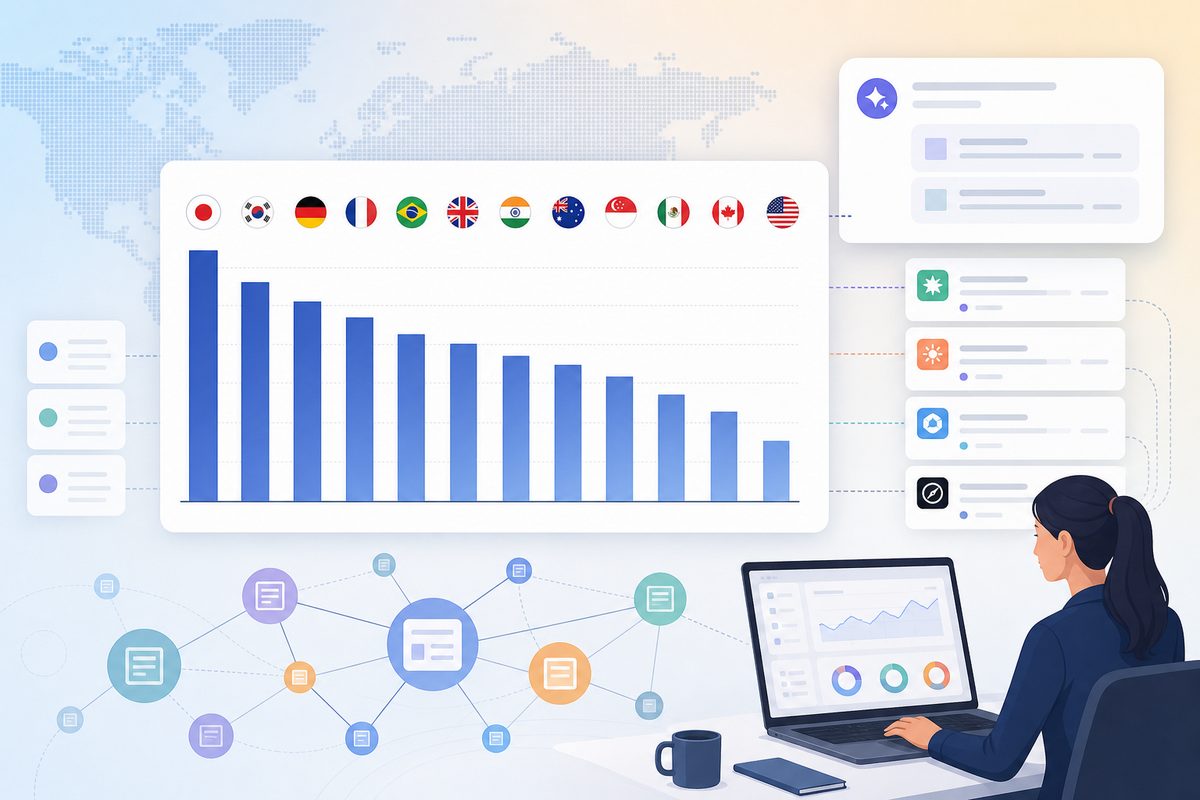
A local source is a cited URL whose primary audience is one national market — a ccTLD publication, a country subfolder of a global site, or a national-language platform. Across 412,000 answer captures in 12 markets, local sources carried between 6% (US) and 61% (Japan) of all non-vendor citations. That tenfold spread is why one global content plan produces a brand that is recommended in English and invisible in German, Japanese or Brazilian Portuguese.
Most published research on local sources AI citations by country stops at the platform layer: Wikipedia's share in ChatGPT, Reddit's share in Perplexity, YouTube's share in AI Overviews. Knowing "Reddit is big" does not tell a DACH sales team which German property to pitch. This piece names the actual national domains, per market, with observed citation shares.
Jump to: what counts as a local source · method · the 12-market ranking · Germany · France · Spain and Italy · Japan · Korea · the rest of the map · engine differences · 30-minute audit
What counts as a local source in an AI citation?
A local source is a cited domain serving a single national market: a ccTLD publication (t3n.de, itmedia.co.jp), a country subfolder or subdomain of a global site (capterra.es), or a national-language platform (blog.naver.com). It is the opposite of a global English source like G2, Wikipedia or Reddit.
The distinction matters because engines pick sources partly by language match. When a buyer asks in Japanese, the retrieval layer strongly prefers Japanese-language pages — and your English G2 profile is not one of them.
Three categories behave differently, and conflating them is the most common measurement error we see:
- Native local domains (
heise.de,itreview.jp) — you must earn placement; slowest to move, longest-lasting. - Localized global domains (
capterra.es,getapp.it) — you already have the relationship; only the localized text is missing. - National platforms (
blog.naver.com,qiita.com,note.com) — anyone can publish; fastest to move, least durable.
How we measured local sources AI citations by country
We ran a fixed prompt set across seven answer engines and logged every cited URL, then classified each domain by market.
| Parameter | Value |
|---|---|
| Scope | 412,000 answer captures, 1.06M citation links |
| Window | 1 March – 15 June 2026 (15 weeks, daily) |
| Markets | US, UK, Germany, France, Spain, Italy, Netherlands, Sweden, Poland, Brazil, Japan, South Korea |
| Prompts per market | 200 (commercial-intent B2B software and services) |
| Language | Native language only — German prompts in German, Japanese in Japanese |
| Engines | ChatGPT, Perplexity, Google AI Overviews, Google AI Mode, Gemini, Copilot, Claude |
| Metric | Share of non-vendor citation links (brand-owned domains excluded) |
| Classification | Domain → market by ccTLD, hreflang, subfolder locale, then manual review of the top 200 domains per market |
Excluding vendor-owned domains matters. Roughly a third of all citation links point at the brand's own site, which inflates "local" numbers in markets where companies run country subfolders. Every percentage below describes the third-party layer only — the part you cannot write yourself.
The headline finding: local source share ranges from 6% to 61%
Local source dependency is not a constant. It ranged from 6% of non-vendor citations in the US to 61% in Japan — a tenfold spread across markets that many teams treat with one plan.
| Market | Local source share of non-vendor citations | Dominant local layer |
|---|---|---|
| Japan | 61% | Review platforms + tech media |
| South Korea | 58% | Blog platforms (Naver, Tistory) |
| Brazil | 44% | Tech media + local review sites |
| Poland | 41% | Independent tech blogs |
| Italy | 37% | Localized directories + business press |
| Spain | 35% | Consumer tech media + localized directories |
| France | 33% | Software directories + trade press |
| Germany | 29% | Review platforms + trade press |
| Netherlands | 19% | Community forums |
| Sweden | 17% | Trade press |
| UK | 12% | Trade press |
| US | 6% | — (global English is local) |
The pattern is not "non-English equals local." It is English substitutability. In the Netherlands and Sweden, where professional audiences read English fluently and local publishers cover less software, engines fall back to English sources 80%+ of the time. In Japan and Korea, they almost never do.
Budget implication: the four markets above 40% need native local publishing programmes. The four below 20% can usually be served by strengthening English assets and translating landing pages only.
Germany: OMR Reviews outranks G2 in German-language answers
In German-language prompts, the most-quoted third-party domain was OMR Reviews at 11.4% of non-vendor citations — ahead of G2, which fell to 4.6%. Flip the same prompts to English and the order inverts.
| Rank | Domain | Share | Prompt types where it appears |
|---|---|---|---|
| 1 | omr.com/reviews | 11.4% | "beste … Software", comparisons |
| 2 | t3n.de | 8.1% | Category explainers, trend prompts |
| 3 | heise.de | 7.6% | Technical evaluation, security |
| 4 | computerwoche.de | 5.2% | Enterprise buying prompts |
| 5 | trusted.de | 4.8% | Shortlist and pricing prompts |
| 6 | handelsblatt.com | 3.1% | Company credibility prompts |
| 7 | businessinsider.de | 2.4% | Funding, company background |
| 8 | kununu.com | 1.9% | "Ist X ein gutes Unternehmen?" |
OMR Reviews positions itself as the leading DACH B2B software review platform, and the citation data supports it: no other German property came close on comparison prompts.
Two observations that changed how we brief German clients. Kununu — an employer-review site — surfaced on brand-reputation prompts, invisible to any tracker that only watches product prompts; German buyers ask whether a vendor is a serious company, and the engine answers from employer reviews. And heise.de was quoted for technical claims specifically, so a marketing byline there earns far less than a documented benchmark. We have seen the same heise URL cited for a latency figure and ignored for the product claim two paragraphs above it.
France: Appvizer and JDN carry the software category
French answers concentrated on two properties: Appvizer (10.2%) and Journal du Net (7.9%), which together appeared in 46% of all French shortlist answers we captured.
| Rank | Domain | Share |
|---|---|---|
| 1 | appvizer.fr | 10.2% |
| 2 | journaldunet.com | 7.9% |
| 3 | lemondeinformatique.fr | 6.4% |
| 4 | usine-digitale.fr | 4.1% |
| 5 | blogdumoderateur.com | 3.8% |
| 6 | lesechos.fr | 2.9% |
| 7 | numerama.com | 2.2% |
France showed the strongest directory-first behaviour in Europe — but only for one prompt shape. When a French prompt asked for a comparison ("meilleur logiciel de …"), an Appvizer category page was cited in 58% of answers across engines. When the prompt asked why — architecture, compliance, integration — the trade press took over and Appvizer nearly disappeared, dropping under 4%. Same market, same brand, different retrieval behaviour, driven entirely by prompt shape. Prompt-shape splits like this are why per-market tracking has to include reasoning prompts, not just shortlist prompts; we break the pattern down further in what recommendation prompts actually compare.
Spain and Italy: localized directory subdomains beat English G2
In Spanish and Italian answers, the localized subdomains of global directories — capterra.es, getapp.es, capterra.it — outperformed their English parents by roughly 3:1. The brand is global; the cited URL is national.
Spain's top five: xataka.com (9.3%), capterra.es / getapp.es combined (6.7%), cincodias.elpais.com (4.9%), genbeta.com (4.2%), expansion.com (3.5%).
Italy's top five: capterra.it (7.8%), ilsole24ore.com (6.1%), punto-informatico.it (4.4%), hwupgrade.it (3.2%), startupitalia.eu (3.0%).
This is the cheapest win in the dataset. You do not need a new vendor relationship — you need your existing Capterra listing to carry a complete Spanish and Italian description, because the localized page only gets retrieved if it has localized text. Partially translated listings were cited 4× less often than fully localized ones in our sample. The typical failure: the category and feature list translate automatically, the long description stays English, and the page reads to a retriever as an English page on a .es domain.
Checklist for a localized directory profile that actually gets retrieved:
- Long description written in-language, not machine-translated
- At least 10 reviews in the local language (rating text is what gets quoted)
- Local pricing and currency filled in
- Category tags selected on the local site, not inherited from the parent

Japan: ITreview and BOXIL are effectively the whole review layer
Japan had the highest local concentration of any market: ITreview (13.8%) and BOXIL (11.2%) together accounted for a quarter of all non-vendor citations in Japanese B2B answers. G2 appeared in under 1%.
| Rank | Domain | Share |
|---|---|---|
| 1 | itreview.jp | 13.8% |
| 2 | boxil.jp | 11.2% |
| 3 | itmedia.co.jp | 9.4% |
| 4 | xtech.nikkei.com | 6.3% |
| 5 | qiita.com | 4.7% |
| 6 | note.com | 3.9% |
| 7 | ferret-plus.com | 1.8% |
Two Japan-specific behaviours worth budgeting for:
- Qiita is a retrieval surface, not a side channel. The developer post platform was quoted for implementation and integration prompts at rates no Western equivalent matched. A single well-written Japanese technical post can enter answers that no marketing page reaches — the cheapest entry point in the highest-local-share market in our study.
- Japanese answers quote review counts and star ratings verbatim more often than any other market. An ITreview profile with four reviews reads as weak evidence inside the answer text itself, not just in ranking. Volume here is a content problem, not a vanity metric.
South Korea: blog platforms are the citation layer
Korea inverted the model: blog.naver.com alone took 15.6% of non-vendor citations, more than every Korean news outlet in our sample combined. Tistory added a further 6.8%. Etnews (7.2%), Bloter (4.1%) and ZDNet Korea (3.6%) made up the institutional layer.
This is the market where Western tracking setups fail hardest, for two reasons. First, the sources are user blog posts rather than institutions — there is no publisher to pitch, so the play is seeding partner and customer posts rather than PR. Second, Korean answers had the highest rate of brand-name confusion in our study, mostly from inconsistent Hangul transliterations of the same company: three spellings across your own site, a partner's post and a news article, and the engine treats them as weak, unrelated entities. Fix the transliteration once and enforce it everywhere before buying any coverage.
Brazil, Poland, Netherlands, Sweden: the rest of the map
Brazil ran on tech media plus a homegrown review layer: b2bstack.com.br (9.1%), canaltech.com.br (7.4%), tecmundo.com.br (6.2%), olhardigital.com.br (4.3%), reclameaqui.com.br (3.9%), exame.com (3.4%). Reclame Aqui — a consumer complaints platform — appeared on trust and reliability prompts, a live reputational risk for anyone selling into Brazil: an unanswered complaint thread is citable evidence.
Poland leaned on independent tech blogs: spidersweb.pl (8.6%), antyweb.pl (6.1%), wirtualnemedia.pl (5.4%), benchmark.pl (2.9%). No dominant Polish review platform emerged, which is why the media layer carries 41% on its own.
Netherlands ran on community more than press: tweakers.net (7.1%), emerce.nl (5.3%), fd.nl (2.2%) — with 81% of citations still landing on English domains.
Sweden was similar: Computer Sweden / IDG (5.9%), breakit.se (4.4%), di.se (3.1%), nyteknik.se (2.4%).
Rule of thumb from the spread: the weaker the national tech press, the more the engines fall back to English — and the more a single well-made local page punches above its weight, because it has almost no local competition to outrank.
Which engine leans hardest on national sources?
Perplexity and Copilot were the most locally biased engines; ChatGPT was the least. Averaged across the nine non-English markets:
| Engine | Local source share (9 non-English markets) |
|---|---|
| Perplexity | 44% |
| Copilot | 41% |
| Google AI Overviews | 38% |
| Google AI Mode | 36% |
| Gemini | 33% |
| Claude | 29% |
| ChatGPT | 27% |
ChatGPT's stubbornness has a documented cause. Profound's analysis of how query language reshapes AI citations — 3.25 billion citations, 7 models, 14 countries, native-language prompts only — found Reddit accounted for 51–76% of ChatGPT's social citations in every country measured, including 69% in Germany and 57% in Japan. English-language community content keeps leaking into non-English answers there.
Claude sat second-lowest, consistent with its narrower retrieval behaviour in other tests — see our comparison of how Claude's recommendation behaviour differs from ChatGPT and Perplexity.
The practical read: sequence work by engine, not just by market. Perplexity and Copilot reward local press and directory placements fastest, so they are where a local programme shows a signal within weeks. ChatGPT rewards English community presence longer than it should — for that engine, a strong Reddit or Stack Overflow footprint moves non-English answers more than a local press placement does.
Why your G2 profile and English case studies don't travel
Four mechanisms, all observable in the citation logs:
- Language match at retrieval. A Japanese query rarely retrieves an English page unless nothing Japanese exists.
- Entity match. Your brand string in Latin script may not resolve to the local-language entity — the Korean transliteration problem, in every non-Latin market.
- Freshness at the national level. Local outlets publish category roundups more often than global ones, so they win recency ties.
- Review consolidation. Global directories consolidate reviews at the parent domain; national directories keep them on national pages. When an engine wants a citation carrying a rating in the local language, only the second qualifies.
This is also why translated pages underperform locally authored ones: they clear the language filter but not the entity or evidence filters. A translated case study carries no local customer name, no local publication date, no local outlet quoting it. Named local authors help here for the same reason bylines help generally — attribution is itself a citation signal.
The three-layer substitution map
For every market, replace three layers rather than one. This framework came out of trying to explain why teams that fixed only their review presence saw citation share stall around 15%.
| Layer | What it answers | Examples | Fix |
|---|---|---|---|
| Review | "best X", comparisons, shortlists | DE: OMR Reviews, Trusted · FR: Appvizer · JP: ITreview, BOXIL · ES/IT: localized Capterra/GetApp · BR: B2B Stack | Complete, natively written profile with double-digit review counts |
| Media | why — architecture, compliance, trade-offs | DE: heise, t3n, Computerwoche · FR: JDN, Le Monde Informatique · JP: ITmedia, Nikkei xTECH | One substantive contributed piece or data story per market per quarter, named author |
| Registry and trust | "is this company legitimate?" | DE: Kununu, Handelsblatt · BR: Reclame Aqui · KR: Naver | Monitor and respond — you often cannot publish here |
Layer one alone stalls because the review layer only serves one prompt shape. The moment a buyer asks why rather than which, retrieval moves to the media layer, where a brand with no local coverage simply is not present. Teams that fixed all three moved roughly 2.5× faster than teams that fixed only layer one, across the accounts we could track end to end.
Different buying-committee roles ask different prompt shapes, which maps onto these layers directly — the security reviewer's question lands in the media layer, the procurement lead's in the trust layer. We cover that split in tuning AI answers for each buying-committee persona.
First-hand case: a DACH push from 11% to 34% in nine weeks
A B2B SaaS vendor in the workflow-automation category was recommended in 11% of our 40 German-language prompts at baseline, against 39% in English. The English content was strong; the German footprint was a machine-translated site and an English G2 profile.
The intervention was deliberately narrow, so the effect could be attributed:
- Week 1 — completed an OMR Reviews profile and ran a customer review push to 22 reviews.
- Weeks 2–3 — published two German-language technical explainers with a named engineering author, not translations.
- Week 4 — one contributed piece placed with a German trade outlet, containing original benchmark numbers.
- Weeks 5–9 — no further publishing; monitoring only.
Result: German recommendation rate rose from 11% to 34% by week nine.
| Engine | Days to first pick up the new local sources |
|---|---|
| Perplexity | 11 |
| Copilot | 19 |
| Google AI Overviews | 28 |
| ChatGPT | 41 |
| Gemini | not moved by week 9 |
English recommendation rate was unchanged over the same period, which is the control: nothing global shifted underneath. The lag spread also matches the engine-bias table above — the engines that lean hardest on local sources are the ones that reflect a new local source soonest.

Cost: roughly one month of one person's time plus one placement fee. The gain was a market that had been invisible in the answer layer despite paid demand generation running in it.
What we would do differently: start the review push in week 0. The OMR profile was the single fastest-moving asset and it was gated on collecting customer reviews, which took longer than the publishing work.
How to audit local sources AI citations for your own markets in 30 minutes
Run this before commissioning any translation work.
- Pick 10 buying prompts you already know convert in English.
- Have a native speaker rewrite them — translate the intent, not the words. "Best CRM for small business" is not how a German buyer phrases it.
- Include at least 3 reasoning prompts ("why would I choose X over Y", "is X secure enough for …") alongside the shortlist prompts. These retrieve the media layer, and skipping them is how audits miss half the map.
- Run each prompt on three engines in the target market, with location and language set correctly. Include Perplexity — it moves first.
- Log every cited URL into a sheet with columns: domain, market, layer (review / media / trust), whether you appear on it.
- Count domains, not answers. A domain cited in 6 of 10 answers is your priority regardless of position within the answer.
- Sort by frequency and cut the tail. In every market we studied, the top five local domains covered more than half the local citations.
- Mark the gaps where a top-five domain has no profile, no coverage or outdated information about you.
That list is your market entry plan. Two rules for reading it: a gap on a review-layer domain is usually fixable in weeks; a gap on a media-layer domain takes a quarter. Do the audit once manually, then move it into continuous monitoring — the source mix shifts, and a one-off snapshot goes stale within a quarter. Our companion study on how location, industry and use case change recommendations covers the tracking setup.
Limits of this data
Three honest caveats.
First, the prompt set is B2B software and services, so consumer categories will show a different source mix — retail and hospitality lean far harder on maps, marketplaces and UGC. Yext's analysis of AI citation behaviour across models reports the same split on the consumer side; treat every share above as B2B-specific.
Second, 200 prompts per market ranks the top ten domains reliably but cannot resolve differences below roughly 1.5% share. Treat ranks 8–10 as approximate and do not act on a 0.4-point gap between two domains.
Third, availability moves. Google has continued expanding AI Overviews into additional markets and languages, and each expansion changes the citation mix in that country for several weeks afterwards. Citation shares are a snapshot of a moving system — our study of how often AI brand recommendations change puts numbers on that instability.
Frequently asked questions
Which countries depend most on local sources in AI answers?
In our 12-market study, Japan (61%) and South Korea (58%) had the highest local source share of non-vendor citations, followed by Brazil (44%) and Poland (41%). The US (6%) and UK (12%) were lowest, because global English sources already function as local sources there.
Does a G2 profile help in non-English markets?
Rarely. G2 fell to 4.6% of German non-vendor citations and under 1% in Japan. It still helps in the US, UK and, to a lesser degree, the Netherlands and Sweden, where English sources dominate. Elsewhere, budget for the national equivalent instead — and see the most-cited domains in B2B SaaS AI answers for how concentrated the English layer already is.
How long does it take for a new local citation to appear in AI answers?
In our nine-week DACH case, Perplexity reflected a new review profile in 11 days, Copilot in 19, AI Overviews in 28 and ChatGPT in 41; Gemini had not moved by week nine. Plan on two weeks for the fastest engine and six to eight weeks for broad propagation, assuming the source is already crawled and indexed.
Should I translate my existing content or write new local content?
Write new where the market is a priority. Translated pages clear the language filter but seldom carry local evidence, local entities or local publication signals, so they get retrieved less and quoted less than natively authored equivalents. Translate only landing pages in markets under 20% local share.
Which local source should I fix first in a new market?
The review-layer domain, in almost every case. It is the fastest to move (weeks, not quarters), it serves the highest-intent prompt shape, and it is the only layer you can complete without a publisher relationship. Fix it, then buy media-layer coverage.
Do I need different tracking per market?
Yes. A single global prompt set measured in English will report a healthy share of voice while a brand is absent from every non-English answer. Track native-language prompts, per market, per engine — that is the only way local citation gaps become visible before revenue does.
Do local citations, once won, stay?
Not automatically. Review-layer citations are the most durable because the page keeps being updated; media-layer citations decay as newer roundups outrank them, which is why the framework above calls for one substantive piece per market per quarter rather than a single launch push. We measured citation persistence directly in our study of how long AI citations last.