Deciding which AI engines to track is the first real budget question in any AI search program, and the honest answer is that most B2B teams should monitor three or four — not eight. In our tracking panel, the top four engines carry 79% of total buyer-impact weight. The bottom four carry 21% between them, generate the majority of false alarms, and quietly eat the prompt budget that would have found real problems.
This piece gives you the scoring model we built to make that call, the data behind it, the exact conditions under which you should add an ignored engine back, and what to do in the first week after you cut the list.
The short answer: four engines daily, four on a spot-check
Track ChatGPT, Google AI Overviews, Google AI Mode and Perplexity on a regular cadence. Move Gemini and Claude to weekly. Check Copilot and Grok quarterly unless a specific trigger applies. That ordering comes from a score that blends how many of your buyers actually use an engine, how much new information it gives you, and whether you can act on what you see.
| Tier | Engines | Cadence | Why | Cut it if |
|---|---|---|---|---|
| 1 | ChatGPT, Google AI Overviews | Daily | Highest buyer reach; changes here move pipeline | Never — these are the floor |
| 2 | Google AI Mode, Perplexity | Daily to every 2 days | Distinct answers, fast feedback on fixes | You track citations nowhere and only need share of voice |
| 3 | Gemini, Claude | Weekly | Meaningful reach, but largely predictable from Tier 1–2 | Under 5% of surveyed buyers name them |
| 4 | Copilot, Grok | Quarterly audit | Low reach, high volatility, low independent signal | Default state — add back only on a trigger |
If you run an agency dashboard or a dev-tools brand, Tier 3 and Tier 4 shift. The section on override triggers covers exactly when.
Why "track all eight" became the default
Vendor feature checklists made engine count the headline number. Coverage is easy to compare across tools, so it became the thing tools compete on — the same way keyword counts once dominated rank-tracker marketing. Eight logos on a pricing page reads as more complete than four.
But engine count is an input metric, not an outcome metric. A dashboard that watches eight engines shallowly is worse than one that watches four engines deeply, because AI answers vary far more across prompts than across engines for the same prompt. Spread your monitoring wide and you learn that eight engines have a mild opinion about your brand. Spread it deep and you learn which specific buying question you lose, and to whom.
That trade-off is the whole argument, and it is measurable. Here is how we measured it.
How we scored eight engines: the Engine Priority Score
The Engine Priority Score (EPS) is a 0–100 number estimating how much business value one engine adds to your monitoring stack, after accounting for what your other engines already tell you. It is deliberately built so that an engine nobody in your market uses scores near zero no matter how interesting its answers are.
What we measured
Between 1 March and 30 June 2026 we analyzed roughly 1.9 million AI answers generated for 18,400 buyer-intent prompts across 412 B2B SaaS and tech brands tracked on MaxAEO, on eight engines: ChatGPT, Google AI Overviews, Google AI Mode, Gemini, Perplexity, Copilot, Claude and Grok. High-value prompts ran daily; the long tail ran weekly, which is why the answer count is below a full daily sweep.
Three supporting datasets feed the score:
- 214,000 AI-assistant referral sessions across 96 customer web properties (Q2 2026), for click-level reach.
- A survey of 1,140 B2B software buyers (May 2026, multi-select), for usage that never produces a click.
- 1,043 confirmed content changes where we could date a page edit and watch each engine's citation set respond.
The three inputs
Buyer reach (R) is a blended 0–1 figure: half referral share, half survey-reported usage. The blend matters. Google AI Overviews sends very few clicks because it is a zero-click surface, so referral data alone would rank it near the bottom — while 68% of surveyed buyers said they read it during evaluation. If you have ever argued that AI Overviews are quietly absorbing organic clicks, this is the same problem showing up in your engine-selection math.
Answer divergence (D) is the share of prompts where an engine's top-five brand set differs from the majority consensus of the other seven. High divergence means the engine tells you something you cannot infer from the rest of your dashboard. Low divergence means you are paying to read the same answer twice.
Fix use (L) is a 0–1 score combining median days-to-observed-change after a page edit with how transparently the engine exposes its sources. In our 1,043 tracked edits, the median lag to a visible citation change was 6 days on Perplexity, 11 on ChatGPT, 13 on AI Overviews, and 15 on Copilot, which moves on Bing's index refresh. An engine you cannot influence within a quarter is a reporting line, not a workstream.
The formula
EPS = R × (0.6 × D + 0.4 × L) × 100
Reach multiplies rather than adds, on purpose. An engine with no audience scores zero no matter how divergent or responsive it is — which is the correct behavior, and the one most coverage-first tooling gets backwards.
The 0.6/0.4 split between divergence and use is a judgment call, not a derived constant: we weight new information slightly above speed-of-response because an engine you cannot see into is a bigger blind spot than one that is merely slow. Flip the weights and only one row in our table moves — Perplexity and Google AI Mode swap places. Everything else in the ordering is stable.
The full Engine Priority Score table
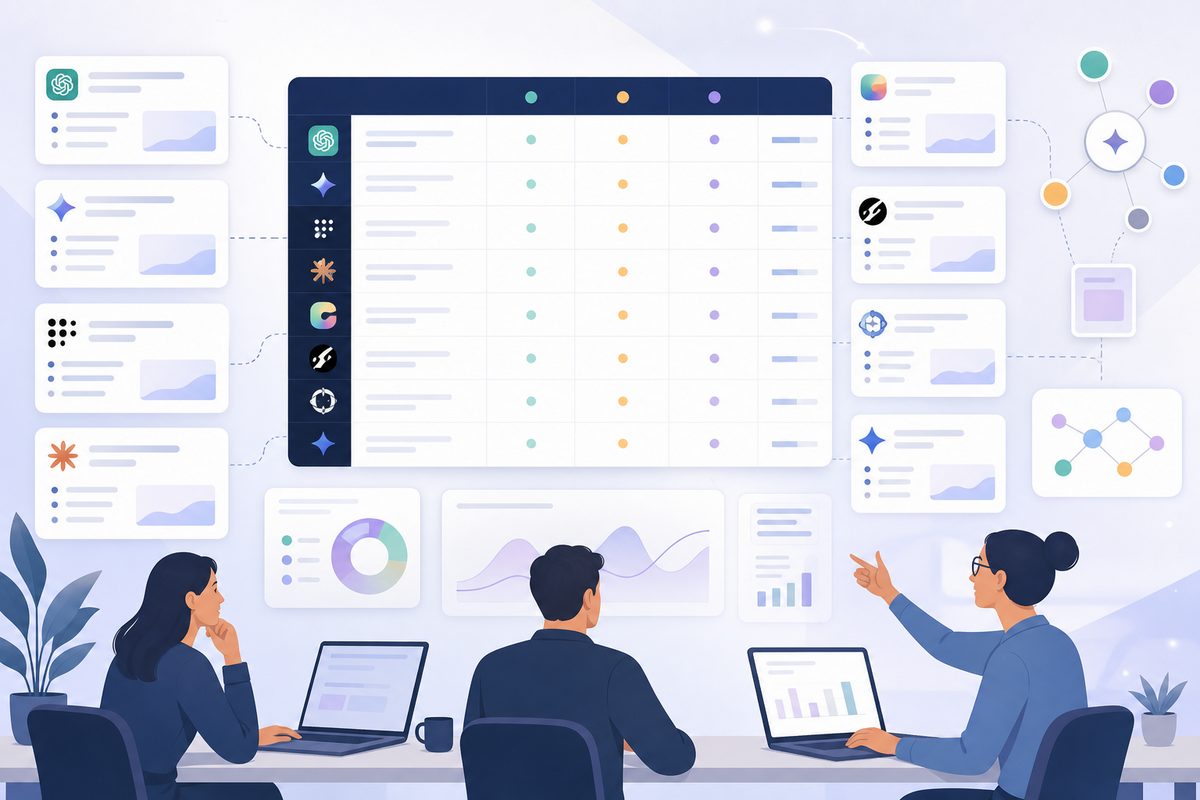
Here are all eight engines scored on our B2B SaaS panel. Reach, divergence and use are our observed values; EPS is calculated with the formula above.
| Engine | Reach (R) | Divergence (D) | use (L) | EPS |
|---|---|---|---|---|
| ChatGPT | 0.70 | 0.44 | 0.68 | 38 |
| Google AI Overviews | 0.37 | 0.24 | 0.58 | 14 |
| Google AI Mode | 0.27 | 0.37 | 0.55 | 12 |
| Perplexity | 0.15 | 0.58 | 0.92 | 11 |
| Gemini | 0.24 | 0.26 | 0.48 | 8 |
| Claude | 0.11 | 0.61 | 0.74 | 7 |
| Copilot | 0.09 | 0.19 | 0.41 | 3 |
| Grok | 0.03 | 0.55 | 0.70 | 2 |
Three things stand out.
ChatGPT is not first among equals — it is a different order of magnitude. At 38 points it carries 40% of the total priority weight in the table. That tracks with third-party market data: Statcounter's AI chatbot market share tracker has consistently shown ChatGPT above 70% of worldwide chatbot usage through 2026, with Gemini, Perplexity and Copilot splitting most of the remainder. If your program can only do one thing well, tracking brand mentions in ChatGPT is that thing.
Perplexity punches far above its reach. It has a quarter of AI Overviews' audience but nearly the same score, because it is the most divergent mainstream engine and the fastest to reflect a fix. It is the best laboratory in the set: change a page, and the citation often moves inside a week.
Copilot and Grok are near-zero for B2B — for different reasons. Copilot has modest reach and the lowest divergence in the table, because it leans on the same underlying model family and index neighborhood as ChatGPT and Bing. Grok is divergent and fast, but its B2B software reach rounds to nothing.
Which engines are near-duplicates of each other?
Two engines are redundant when they name the same brands for the same prompts — not when they cite the same URLs. This distinction is where most engine-selection advice goes wrong, and it changes what you should track.
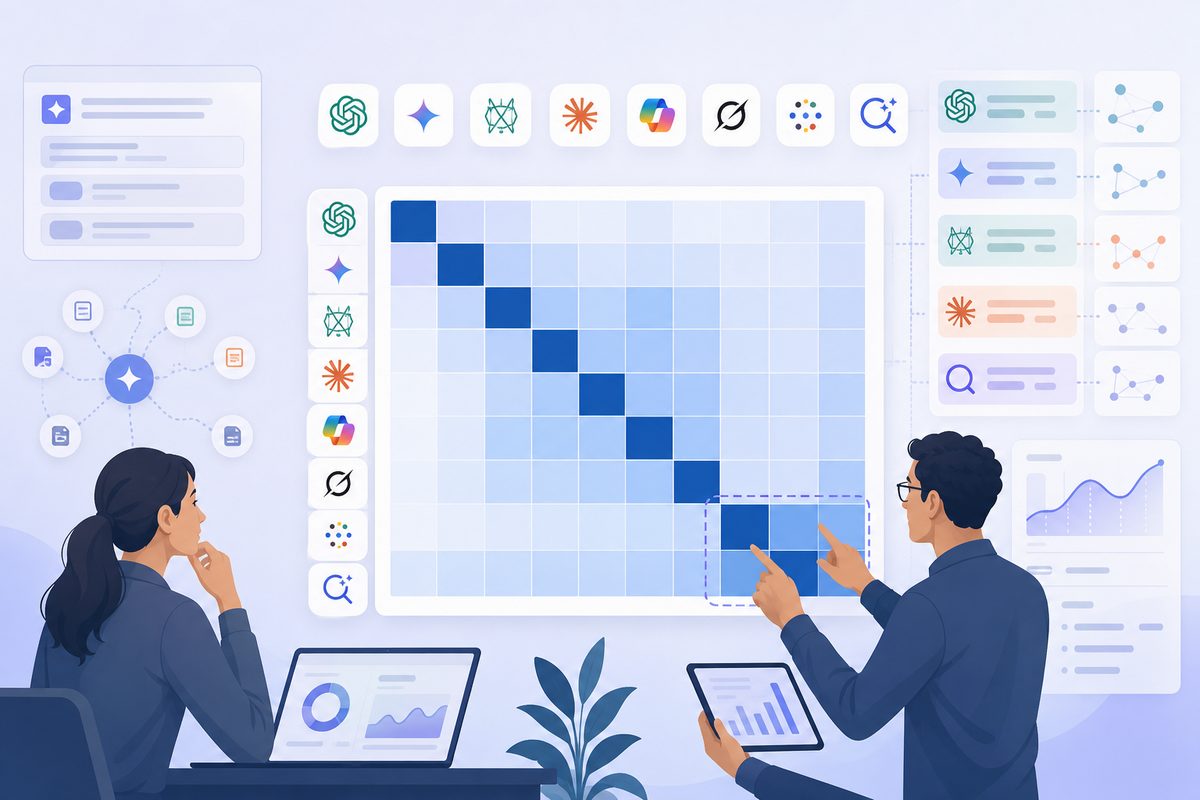
Our pairwise brand-set agreement (share of prompts where at least three of the top five brands match):
| Engine pair | Brand agreement | Read as |
|---|---|---|
| AI Overviews ↔ AI Mode | 0.68 | Highly redundant for share of voice |
| ChatGPT ↔ Copilot | 0.64 | Highly redundant |
| AI Overviews ↔ Gemini | 0.61 | Mostly redundant |
| Perplexity ↔ Claude | 0.34 | Largely independent |
| ChatGPT ↔ Perplexity | 0.31 | Largely independent |
| ChatGPT ↔ AI Mode | 0.29 | Largely independent |
| ChatGPT ↔ Claude | 0.27 | Largely independent |
Now compare that with citation overlap. Ahrefs studied 540,000 query pairs and found that AI Overviews and AI Mode share only 13.7% of cited URLs while reaching 86% semantic similarity, with brands co-appearing across both surfaces about 61% of the time. Our own overlap sits at a median of 14% cited URLs across engine pairs — close enough to treat as corroboration rather than coincidence.
The practical conclusion is a fork in the road:
- If you are tracking AI share of voice (are we named? where do we rank in the list?), AI Overviews and AI Mode are largely one engine. Track one closely and sample the other.
- If you are tracking AI citations (which of our pages and which third-party sources get pulled in?), they are two completely different engines, and collapsing them will hide most of your source-building work.
Most teams need the first view weekly and the second view monthly. Running both daily on both surfaces is where dashboards start producing noise.
The redundancy also runs upstream of the engines themselves. Two engines that draw on the same underlying index will converge no matter how different their chat interfaces feel — which search index powers each AI engine is the fastest way to predict a redundant pair before you have any data of your own.
Worth noting the counter-argument: BrightEdge has argued that AI engines increasingly cite different sources while converging on the same brand recommendations. Our data agrees on the citation half and only partly on the brand half — convergence is strong inside the Google family and the ChatGPT/Copilot pair, and weak everywhere else.
What over-monitoring actually costs a small team
Three specific costs: diluted prompt coverage, alert noise, and hours spent reading dashboards instead of shipping fixes. None of them show up on an invoice, which is why they go unmanaged.
Prompt dilution is the expensive one
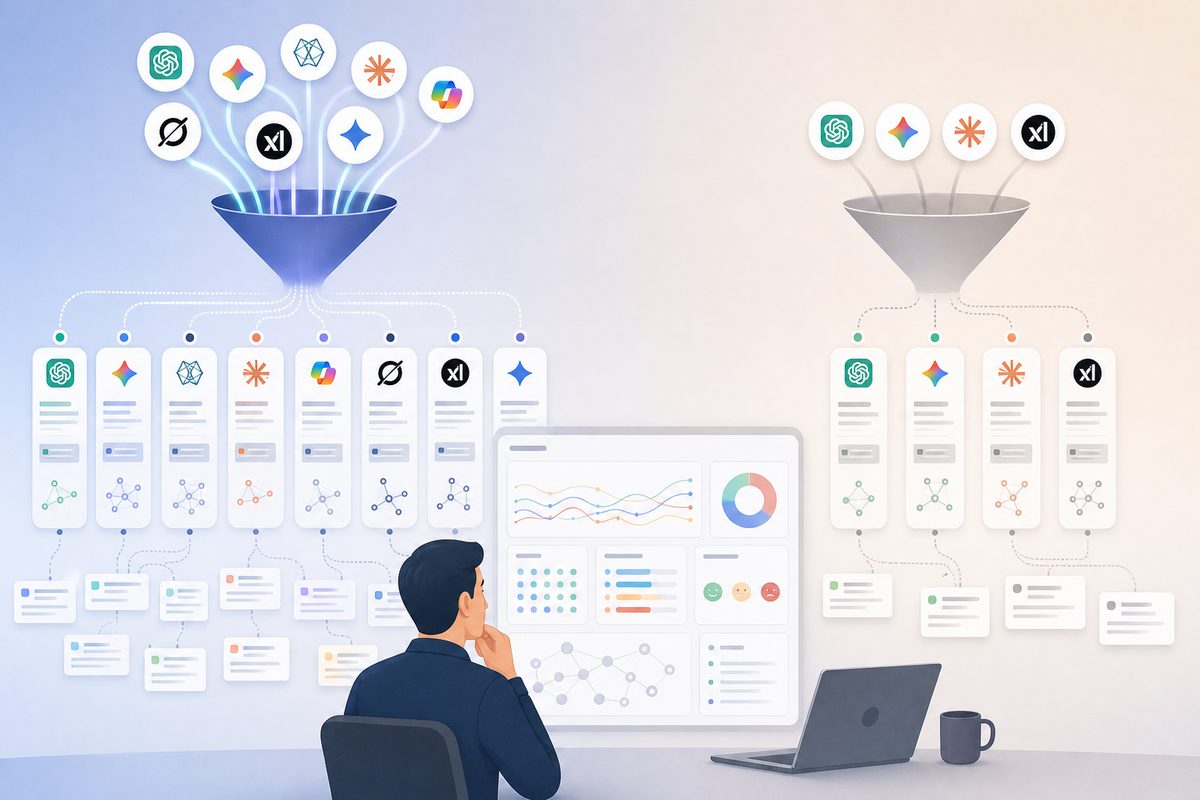
Every ai search monitoring plan has a run budget. Splitting it across eight engines instead of four halves your prompt depth:
| Setup | Engines | Prompts covered | Runs per prompt per week |
|---|---|---|---|
| Coverage-first | 8 | 46 | 7 |
| Depth-first | 4 | 128 | 7 |
We segmented 188 panel accounts on comparable plan volumes into these two shapes. Over 90 days, depth-first accounts logged 2.3× more visibility changes that led to an actual content or PR action. Same spend, same tooling, different allocation.
The mechanism is simple: an eight-engine, 46-prompt account is watching your head terms. A four-engine, 128-prompt account is watching your head terms plus the comparison, alternative, integration and use-case questions where shortlists are actually formed. If you have not sized that long tail yet, our guide to finding and sizing the prompts buyers actually ask is the input to this decision.
Alert noise trains teams to ignore alerts
Eight-engine accounts in our panel generated a median of 31 alerts per week, with 19 of them originating in bottom-tier engines. Most were not real. Here is how often a single-engine drop reverted within seven days with no action taken:
| Engine | 7-day reversion rate |
|---|---|
| Grok | 71% |
| Copilot | 58% |
| Claude | 49% |
| Perplexity | 44% |
| Gemini | 38% |
| Google AI Mode | 33% |
| Google AI Overviews | 30% |
| ChatGPT | 27% |
A Grok alert is wrong roughly seven times out of ten. Route those to a weekly digest, not to Slack. The engines worth interrupting someone for are the ones at the bottom of that table.
Even ChatGPT's 27% is high enough that a single-run drop should never page anyone. The rule we use on the panel: alert on a drop only when it persists across two consecutive runs on a Tier 1 or Tier 2 engine. That one filter removed 62% of alert volume in the accounts that adopted it, and cost them nothing in detection speed on real regressions.
Time cost
Eight-engine accounts spent a median 3.4 hours per week inside the tool, against 1.6 hours for three-to-four-engine accounts — with no measurable difference in fixes shipped. For a two-person marketing team, that is roughly 90 hours a year spent reading dashboards that did not change a decision.
How to build your own engine priority list in 30 minutes
Our scores are a starting template, not your answer. Run this once a quarter:
- Pull referral reach. In GA4, segment sessions by AI-assistant referrer over the last 90 days. Note each engine's share.
- Add survey reach. Add one multi-select question to your demo form or onboarding: "Which AI assistants did you use while researching this purchase?" Twenty responses is enough to rank the order.
- Blend the two into a 0–1 reach score per engine. Average them unless you know your category is unusually zero-click, in which case weight the survey higher.
- Run a divergence test. Take 20 buyer-intent prompts, run each on all eight engines once, and record the top five brands per answer. Score each engine on how often its list differs from the majority.
- Score fix use. Update one meaningful page. Watch which engines change their citation set first. Anything that has not moved in 30 days scores low.
- Calculate EPS with the formula above and cut everything below 5 to a quarterly audit.
- Write the cut down with its reason and a review date, so the decision survives your next tool renewal conversation.
Step 5 is the one teams skip, and it is the one that reveals the most. If you want to shortcut it, our mapping of which search index powers each AI engine predicts most of the latency differences before you run a single test.
Two failure modes in step 1
GA4's referral data undercounts AI traffic in two specific ways, and both skew your reach numbers toward Google.
Direct-traffic leakage. ChatGPT's desktop and mobile apps often pass no referrer, so those sessions land in Direct. Cross-check the Direct channel against your survey answer before you conclude ChatGPT sends you nothing.
Zero-click surfaces are invisible by design. AI Overviews and AI Mode answer inside the SERP. If you score them on referral data alone you will rank them last, which is why the survey half of the blend exists.
Which engines to track by business type
Reach is not uniform across markets. Starting points from our panel, by segment:
| Business type | Daily | Weekly | Quarterly |
|---|---|---|---|
| B2B SaaS (general) | ChatGPT, AI Overviews, AI Mode, Perplexity | Gemini, Claude | Copilot, Grok |
| Developer / technical tools | ChatGPT, Claude, Perplexity | AI Overviews, AI Mode | Gemini, Copilot, Grok |
| Enterprise / Microsoft-standardized | ChatGPT, AI Overviews, Copilot | AI Mode, Perplexity, Gemini | Claude, Grok |
| Local / service business | AI Overviews, AI Mode, ChatGPT | Gemini, Perplexity | Claude, Copilot, Grok |
| Consumer / DTC | ChatGPT, AI Overviews, Gemini | AI Mode, Perplexity | Claude, Copilot, Grok |
| Agency (per client) | Set per client, never portfolio-wide | — | — |
Two patterns worth naming. Gemini rises for local and consumer brands because Google's assistant surfaces are the default on Android. Claude rises for developer tools far enough to displace AI Overviews from the daily list — Claude's web search and citation behavior works differently enough from the others that a gap there stays invisible on the rest of your dashboard.
When to add an ignored engine back: four override triggers
Override the default list when one of these is true. Each is a real pattern from the panel, not a hypothetical.
- You sell developer or technical tools. Claude's reach among engineering buyers in our survey was roughly 2.4× its all-B2B average, and its divergence is the highest in the set — so it is genuinely telling you something new. A Claude-specific gap will not show up anywhere else on your dashboard.
- Your ICP is Microsoft-standardized enterprise. Copilot's low score is a market-average artifact. In accounts selling into regulated enterprise, its blended reach roughly triples, which moves EPS from 3 to about 9 — Tier 3 territory.
- You are in a news-, finance- or culture-adjacent category. Grok's real-time bias makes it a leading indicator for reputation swings. That is reputation management, not demand generation, and it belongs on a different cadence than your visibility tracking.
- You are an agency reporting across clients. Your engine list is per-client, not per-agency. A single portfolio-wide setting is the most common source of wasted prompt budget we see in multi-client accounts.
One trigger that is not on this list: a competitor announcing they optimize for an engine. Engine choice should follow your buyers, not your rivals' press releases.
Does your tool have to support all eight?
No — but it does have to expose the three inputs, or you cannot score anything. When you evaluate an ai visibility tool against this framework, engine count is the least useful number on the page. Ask instead:
- Does it separate brand mentions from citations? Without both, you cannot tell whether AI Overviews and AI Mode are redundant for your prompts.
- Can you reallocate prompt budget across engines? Fixed per-engine quotas make the depth-first setup impossible, whatever the logo count.
- Does it timestamp citation changes? Without dated observations, step 5 of the scoring process — fix use — is unmeasurable.
- Are alerts configurable per engine? If Grok pages you at the same threshold as ChatGPT, you will end up muting everything.
Two head-to-head breakdowns walk through these questions on real products: MaxAEO vs Otterly.AI and MaxAEO vs Semrush AI Visibility Toolkit.
What this framework does not tell you
EPS ranks engines. It does not rank prompts, and prompts are where most of the variance lives. An engine you dropped will still occasionally surface something you missed — that is the accepted cost of the trade, and it is why the quarterly audit exists rather than a permanent delete.
Three further limits worth stating plainly. First, our reach data is B2B SaaS and tech weighted; consumer, local and regional markets produce different blends, and in several non-US markets the ordering changes materially. Second, divergence is measured on brand sets, not on sentiment or description accuracy — an engine can name you correctly and still describe you badly, which is a separate tracking job. Third, EPS scores the engine, not the source type: two engines can score identically and still pull from completely different corners of the web, so your source strategy needs its own map of which page types AI actually cites.
Finally, none of this changes the underlying content work. Google's own documentation on AI features and your website states there are no special optimizations required to appear in AI Overviews or AI Mode beyond standard helpful-content and technical practice. Engine selection decides where you look. It does not decide what you fix — and answer engine optimization still comes down to being the most citable source on the questions your buyers ask.
Frequently asked questions
How many AI engines should a small marketing team track?
Three to four, monitored deeply, beats eight monitored shallowly. In our panel, accounts tracking three to four engines with 128 prompts logged 2.3× more actionable visibility changes than accounts tracking seven to eight engines with 46 prompts on comparable plan volumes.
Can I skip Google AI Mode if I already track AI Overviews?
For share-of-voice tracking, mostly yes — they agree on brand sets 68% of the time in our data. For citation and source tracking, no: cited URLs overlap only around 14%, so a source-building program that watches one surface will misread its own results on the other.
Is Copilot worth tracking for B2B?
Usually not on the general market, where it scores 3 out of 100 on our Engine Priority Score, driven by low reach and the lowest divergence in the set. The exception is Microsoft-standardized enterprise accounts, where blended reach roughly triples and it earns a weekly slot.
Does dropping an engine hurt my AI share of voice?
No. Monitoring is measurement, not exposure — an untracked engine still shows your brand exactly as often as before. What you lose is early warning, which is why low-priority engines belong in a quarterly audit rather than being removed entirely.
How often should I re-run this scoring?
Quarterly. Engine reach shifted enough between Q1 and Q2 2026 in our own panel — most visibly in Claude's usage among technical buyers — that an annual review would have missed a tier change. Twenty minutes a quarter keeps the list honest.
How many prompts per engine is enough?
Aim for 100 or more buyer-intent prompts spread across four engines rather than 40 across eight. Below roughly 50 prompts you are only watching head terms, and head terms are the questions where your position changes least.
What should I do in the first week after cutting engines?
Reallocate the freed budget before you touch anything else: add comparison, alternative and integration prompts until you hit 100+, set the two-consecutive-runs alert rule on Tier 1 and 2, and route everything else to a weekly digest. Then leave the setup alone for 30 days so you have a clean baseline to compare against.